
MQ V6 introduced a tool to help with administration and problem diagnosis in an MQ network. The dspmqrte program shows the route that a message might take, reporting on the transmission queues and channels. It is considered MQ’s equivalent to the TCP/IP traceroute. This post discusses a new variation, dspmqrtj, available on GitHub, that shows MQ message routing in JSON format.
History and Evolution
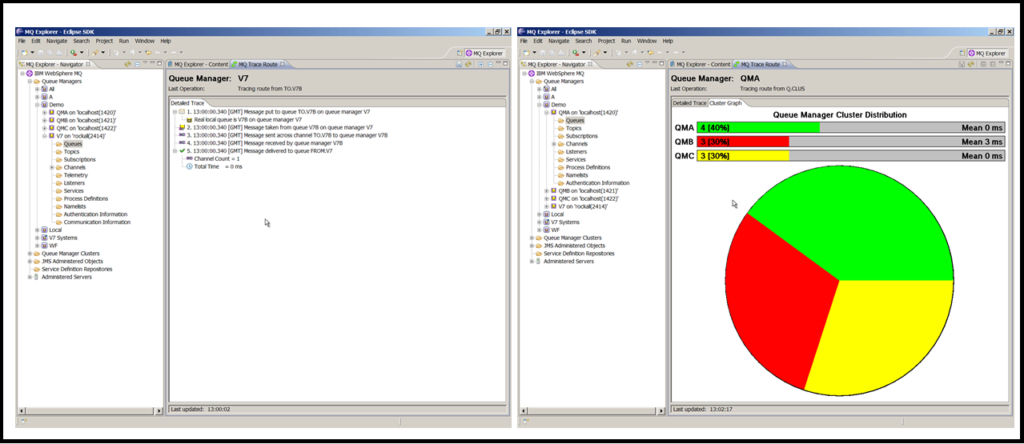
Soon after the release of MQ V6, I created a plugin for the MQ Explorer that did something similar but could be driven by clicking on an object in the panels. This MS0P SupportPac component had two features beyond the product-shipped dspmqrte:
- It showed a summary of the complete flow
- It could send multiple messages to a clustered queue and show the distribution to the different receiving queue managers
With a broad strategy of making as much MQ information available as possible in JSON format, I wanted to do something with the message tracing feature. And so I looked at taking that Java code and reworking it as a command-line tool that could print to the screen instead of doing things graphically. Changing the dspmqrte program was not going to be an opti0n, at least for now. Once I started on the changes, I quickly decided that I would switch to using Go as the programming language instead. One reason for that was the inbuilt support for creating JSON objects.
Language Aside: I started this project in Java and converted it to Go. For another project I worked on last year, I wrote the prototype in Go. But I then switched to Java for the final version. The reasons for the final language choice were different for both, but it’s good to have the flexibility.
Deprecation Aside: One thing that started to slightly irritate me while working on this was how the Go bindings deal with the different PCF data types (integer, string, arrays etc). Noone to blame but myself for the choice – I think I didn’t originally appreciate use of the interface{} syntax in the language when creating the bindings. If I ever do a version of the Go interface that requires a new major number (it’s currently v5) then I may change the PCF interface. I did put a comment to that effect in the DEPRECATIONS file, though there’s no current plans to do such a version, or anything I can forsee that will require it.
Examples
This first extract is a reminder of how the dspmqrte program looks:
AMQ8653I: DSPMQRTE command started with options '-c -m FR1 -q LOOP.ALIAS -v outline'.
AMQ8659I: DSPMQRTE command successfully put a message on queue 'FR2.XMIT', queue manager 'FR1'.
AMQ8674I: DSPMQRTE command is now waiting for information to display.

Activity:
  ApplName: 'dspmqrte                    '
Operation:
   OperationType: Put
   QMgrName: 'FR1                                          '
   QName: 'LOOP.ALIAS                                      '
   ResolvedQName: 'FR2.XMIT                                '
   RemoteQName: 'LOOP.RETURN                                 '
   RemoteQMgrName: 'FR2                                    '
...
Running the same test with dspmqrtj, we get
{
   "summary": {
     "parameters": "-m FR1 -q LOOP.ALIAS -channel SYSTEM.DEF.SVRCONN -connName localhost(4714) -maxWait 3s",
     "success": "Message successfully reached a destination",
     "totalTimeMilliSec": 0,
     "channelCount": 2,
     "finalQueueManager": "FR1"
   },
   "activities": [
     {
       "applName": "dspmqrtj",
       "applType": "Unix",
       "description": "Display Route Application (GO/JSON Version)",
       "operations": [
         {
           "operation": "Put",
           "date": "2022-03-07",
           "time": "09:07:42.68",
           "epochMilliSec": 1646644062680,
           "details": {
             "localQueueManager": "FR1",
             "objectName": "LOOP.ALIAS",
             "objectType": "queue",
             "remoteQueue": "LOOP.RETURN",
             "remoteQueueManager": "FR2",
             "resolvedQueue": "FR2.XMIT"
           }
         }
       ]
     },
...
The first element in this output is a summary of the flow. It shows whether or not the message did reach a destination and how long it took. It also shows how many channels were traversed. Timestamps in each operation show both a readable date/time and a converted epoch format. Again, that can make it easier for tools to calculate elapsed time at each stage.
There is then an array of activities (basically each MQ process that touches the message), each of which contains a list of operations (usually a PUT/GET or a channel flow).
Having the output in JSON makes it possible to extract and format individual fields in a consistent way. Running exactly the same test, but passing the output to jq, I can see which operations were done with no complicated coding or pattern matching:
$ dspmqrtj -m FR1 -q LOOP.ALIAS -channel SYSTEM.DEF.SVRCONN -connName 'localhost(4714)' -maxWait 3s |\
   jq -r '.activities[].operations[].operation'
 Put
 Get
 Send
 Receive
 Put
 Get
 Send
 Receive
 Discard
We always look for “Discard” as the final operation as it means that the tracer message has successfully reached a queue and that the return route is working.
Using jq, along with standard Unix programs, we can also construct the equivalent of the Explorer pie chart for showing cluster distribution. This cluster was defined with 4 partial repositories, 3 of which host the CLUS.WL.TEST queue. The trace messages are put to the fourth queue manager, and should be evenly distributed across the 3 available instances. The -msgCount parameter on the command line says how many times to run the trace:
$ dspmqrtj -m PR1 -q CLUS.WL.TEST -msgCount 10 -bind notfixed |\
 jq -r '.summary.finalQueueManager' |\
 sort | uniq -c
     3 PR2
     4 PR3
     3 PR4
For JSON-consuming programs that prefer to have the text presented on a single line instead of pretty-printed, the -oneLine command option gives an alternative format.
Error handling
If there is a real error reported, then the JSON includes an error block:
"summary": {
     "parameters": "-m FR1 -q Q.NOT.DEFINED -channel SYSTEM.DEF.SVRCONN -connName localhost(4714) -maxWait 3s",
     "totalTimeMilliSec": 0
   },
   "error": {
     "description": "Cannot open queue Q.NOT.DEFINED",
     "detailedError": "MQOPEN: MQCC = MQCC_FAILED [2] MQRC = MQRC_UNKNOWN_OBJECT_NAME [2085]",
     "mqcc": 2,
     "mqrc": 2085
   }
And to see situations where no error has occurred but something is blocking the flow – in this case a channel that has not been started – the summary has a failure element. The rest of the output gives an idea of how far the trace reached, and therefore where you should start looking to work out what might be wrong.
"summary": {
     "parameters": "-m FR1 -q DEAD.END -channel SYSTEM.DEF.SVRCONN -connName localhost(4714) -maxWait 3s",
     "failure": "Message not reported at a final destination",
     "totalTimeMilliSec": 1646646527880
   },
...
The source code repository
I’ve put the code for this program in the same repository as the metric collectors. Those include a JSON variation as well as versions for databases like Prometheus, and this has a similar aim of using a common output format. You can clone the full repository and go directly to the dspmqrtj subdirectory if you only want to look at this piece.
This program builds on the Go MQI bindings layer, but all of the prerequisite source code is in the vendor directory so you don’t need to clone any other repositories. To build the program, a Go compiler and a C compiler should be all you need along with a copy of the MQ client and SDK package.
Demonstration script
The repository contains some test scripts to build a cluster, and then run these examples. So you should be able to replicate them for yourself.
The demo.sh script also makes it look as if you are typing the commands (accurately), which can be an effective way to do demonstrations. It can be really horrible watching demonstrations when someone cannot drive the tests at a reasonable pace and spends more time entering commands than showing the real features.
Conclusion
I know that some users have tooling for regularly running dspmqrte as part of monitoring the health of their MQ estate. This version of the tool started as an experiment to see if JSON was a good idea for looking at message flows, perhaps making it simpler to integrate with other monitoring solutions. I think this works but I’d be interested in any feedback.
This post was last updated on March 8th, 2022 at 10:15 am