My previous post was about one small project I got involved with over the last week. This is another one prompted by working with an MQ user, this time to do with metrics. Essentially they had an urgent need to do some basic MQ queue rate monitoring: how many messages were put/got in an interval. More sophisticated observability, whether using a product like Instana, or tools such as these, would be a later exercise. I described what MQ can generate, and what some of the provided sample programs do, but decided it was more interesting to demonstrate it with real running code.
I also think of this as the coding version of the “Yes, And …” rule for Improv. Start with one piece and see where it leads. I ended up with 3 pieces – collect data, format data, display data. Each piece had some utility on its own, but I then thought “Yes, and then what can I do to demonstrate the next phase most effectively.”
Collect the data
If I want to see information about message counts on queues, there are (at least) three different ways of getting it:
- Use the RESET QSTATS command. I don’t like this, but it’s what a lot of traditional tools use. My objections are twofold: on Distributed platforms it’s only available via PCF, not MQSC commands; and it’s easy for two tools to interfere with each other, confusing the statistics.
- Use STATISTICS event messages. These are trivial to configure on the queue manager. Although only one program can conveniently consume these events, it is possible to redefine an environment so that multiple consumers can get at them via pub/sub.
- Use the published resource metrics, most easily demonstrated with the
amqsruasample program.
For this simple case, I decided to use the regular event messages. The minimum configuration needed was ALTER QMGR STATQ(ON) though I also set STATINT(30) so I could get frequent updates for testing. Other statistics types that the queue manager supports were not going to be useful for this limited scenario.
Format the data
MQ includes two sample programs that know how to format the statstics events: amqsmon and amqsevt. It should be no surprise, if you’ve read any of my other posts about monitoring, that I used amqsevt with JSON output. That was then piped to a jq program to extract just the fields I wanted to display.
The output from the amqsevt phase looks like this:
"eventData" : {
  "queueMgrName" : "QM1",
  "startDate" : "2022-10-05",
  "startTime" : "12.12.35",
  "endDate" : "2022-10-05",
  "endTime" : "12.13.05",
"queueStatisticsData" : [ {
  "queueName" : "APP.1",
  "queueMinDepth" : 0,
  "queueMaxDepth" : 0,
  "puts" : [
    10,
    7
   ],
  "putsFailed" : 0,
  "put1s" : [
    2,
    0
   ],
...
The jq filter took that information and worked out the rates. One element of that was to convert timestamps into epoch values so the interval duration could be derived. Part-way through the jq filter, after calculation of the Put rate, we could see lines like these:
{"periodStart":1664975480,"periodEnd":1664975510,"duration":30,"startTime":"12.11.20","queueMgr":"QM1","queue":"APP.4","putNP":82,"putP":0,"putTotal":82,"rate":2.73}
{"periodStart":1664975480,"periodEnd":1664975510,"duration":30,"startTime":"12.11.20","queueMgr":"QM1","queue":"AMQ.6335A96421EFDD01","putNP":156,"putP":0,"putTotal":156,"rate":5.2}
{"periodStart":1664975480,"periodEnd":1664975510,"duration":30,"startTime":"12.11.20","queueMgr":"QM1","queue":"LOOP.OUTPUT","putNP":4,"putP":0,"putTotal":4,"rate":0.13}
{"periodStart":1664975480,"periodEnd":1664975510,"duration":30,"startTime":"12.11.20","queueMgr":"QM1","queue":"APP.3","putNP":93,"putP":0,"putTotal":93,"rate":3.1}
This was where I originally planned to stop. It should be good enough to send to any analytics processing tool. But the “Yes, and…” kicked in. I did another layer of filtering and formatting to show just the critical information. And it looks like this:
[1664975510,"AMQ.6335A96421EFDD02",6.67]
[1664975510,"APP.2",2.17]
[1664975510,"AMQ.6335A96421EFDD01",5.2]
[1664975510,"LOOP.OUTPUT",1.63]
[1664975510,"APP.3",1.53]
[1664975510,"APP.1",2.27]
[1664975510,"APP.0",0.23]
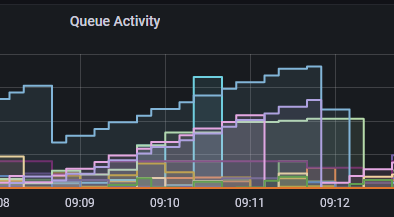
Display the data
I thought it might be nice to show that data in a simple format so you can see the state a bit more easily. I did consider using a graph-plotting tool (perhaps Python’s matplotlib library) but that would require learning Python first. Which is a larger project for another day. Instead I’m just going to show the current state in a text table. With a little bit of shell programming using Associative Arrays, I got to:
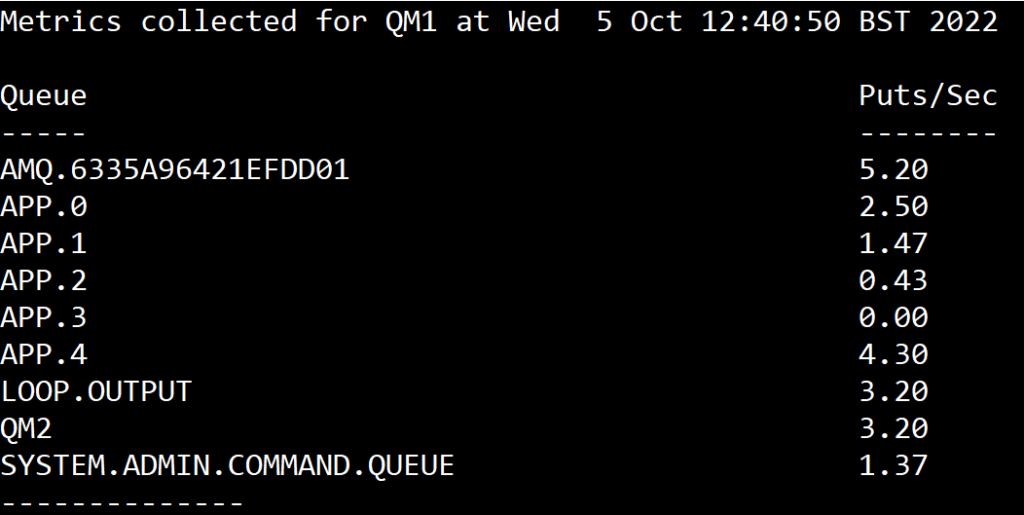
That screen updates on each STATINT interval. So the final driving script was as simple as
QM=QM1
. setmqenv -m $QM -k
export PATH=$PATH:/opt/mqm/samp/bin

# Use stdbuf to ensure output is unbuffered and printed immediately
stdbuf -o0 amqsevt -m $QM -q SYSTEM.ADMIN.STATISTICS.QUEUE -o json |\
  jq -f statsCount.jq -c --unbuffered |\
  table.sh $QM
And that’s where I’ve decided to stop. For anything more advanced, use a real monitoring tool. But for the quick-and-dirty, fast-response requirement this should give a skeleton of what can be done.
You can access the full code, such as it is, as a zip file here.
Summary
I quite like being able to string together these different tools. It’s always been the Unix approach and it works well for this kind of requirement. Rather than building analytics into a formatter program, do each task independently and make sure the next component can process the output on the pipe.
File Download: Also available from this gist.
This post was last updated on November 15th, 2022 at 12:41 pm
One thought on “Snippet 2 – Basic MQ Queue Rate monitoring”