Snippet 2 – Basic MQ Queue Rate monitoring

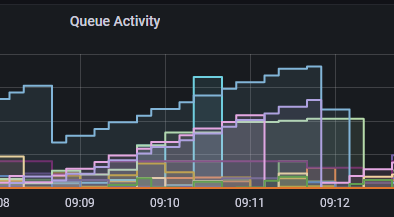
My previous post was about one small project I got involved with over the last week. This is another one prompted by working with an MQ user, this time to do with metrics. Essentially they had an urgent need to do some basic MQ queue rate monitoring: how many messages were put/got in an interval. More sophisticated observability, whether using a product like Instana, or tools such as these, would be a later exercise. I described what MQ can generate, and what some of the provided sample programs do, but decided it was more interesting to demonstrate it with real running code.

I also think of this as the coding version of the “Yes, And …” rule for Improv. Start with one piece and see where it leads. I ended up with 3 pieces – collect data, format data, display data. Each piece had some utility on its own, but I then thought “Yes, and then what can I do to demonstrate the next phase most effectively.”

Continue reading “Snippet 2 – Basic MQ Queue Rate monitoring”

This post was last updated on November 15th, 2022 at 12:41 pm
Durable subscriptions to minimise object handle use

Collection of the metrics that the queue manager publishes requires that each monitored queue has at least one associated subscription. This post describes an interesting option where collection programs use durable subscriptions to minimise object handle use when running MQ monitoring. It reduces the requirements for configuring the MAXHANDS attribute on the queue manager. It’s also a nice demonstration of how subscriptions could be used in any application.

Continue reading “Durable subscriptions to minimise object handle use”

This post was last updated on June 30th, 2022 at 07:23 am

Using Prometheus to monitor MQ channel status

In 2016 I wrote about how MQ’s resource statistics can work with a number of time-series databases, including Prometheus. This permits monitoring using the same tools that many customers use for monitoring other products. It allows easy creation of dashboards using tools such as Grafana.

Since that original version, we’ve made a number of enhancements to the packages that underpin that monitoring capability. For example, more database options were added; a JSON formatter appeared. One notable change was when we split the monitoring agent programs into a separate GitHub repository, making it easier to work with just the pieces you needed.

And now, I’ve released some changes that allow Prometheus and generic JSON processors to see some key channel status information. In particular, a Grafana dashboard can easily highlight channels that are not running.

Continue reading “Using Prometheus to monitor MQ channel status”

This post was last updated on November 25th, 2019 at 09:53 am

IBM MQ – Using AWS CloudWatch to monitor queue managers

In this final(?) blog entry of a series, I’m going to show how you can monitor MQ queue managers using Amazon’s CloudWatch service.

Continue reading “IBM MQ – Using AWS CloudWatch to monitor queue managers”

This post was last updated on November 23rd, 2019 at 12:28 am

IBM MQ – Further integration with open-source monitors

An earlier blog entry showed how to integrate MQ with the Prometheus database, capturing statistics that can then be shown in a Grafana dashboard. In this article, I’ll show how that initial work has been extended to work with more databases and collection tools.

The latest updates allow MQ to write directly to InfluxDB and OpenTSDB databases, and also to provide data to collectd.

Continue reading “IBM MQ – Further integration with open-source monitors”

This post was last updated on November 27th, 2021 at 03:00 pm