IBM MQ has always been able to generate event messages when something “interesting” has occurred in the queue manager. These events could be showing that a queue is full, or that there has been an authorisation failure; someone needing an audit trail might want to capture the command and configuration events. These events are written as MQ messages to well-known queues, using PCF structures which can be decoded to give the full description of the event.
The amqsevt sample program
IBM MQ V8.0.0.4 included a new sample program, amqsevt, designed to format these event messages. That fixpack contained both the executable program and source code for it. You can see more about the formatter in this video. Here is an event as printed by the program:
**** Message #7 (236 Bytes) on Queue SYSTEM.ADMIN.PERFM.EVENT ****
Event Type                     : Perfm Event [45]
Reason                         : Queue Full [2053]
Event created                  : 2016/10/21 07:11:28.58 GMT
  Queue Mgr Name               : V9000_A
  Base Object Name             : FULLEVT
  Time Since Reset             : 0
  High Queue Depth             : 4
  Msg Enq Count                : 0
  Msg Deq Count                : 0
Displaying events in this more readable, English-like, style can be very useful for administrators who want to see what is going on, without using a more formal monitoring product. However, there are times when a format more suitable for programmatic processing are needed.
A modified version for JSON
The common MQ management and monitoring tools such as Omegamon are all able to decode the PCF messages, and take appropriate actions or generate alerts from these events. But many customers now want to integrate these events with other tools, that perhaps do not have an MQ-specific component or heritage. And so I’ve produced a modified version of the amqsevt program that can print the events in JSON, which is a simple format, but one which is capable of being parsed and searched with a variety of tools.
This example shows the same event as above, but formatted as JSON:
{
  "eventSource" : {
    "objectName" : "SYSTEM.ADMIN.PERFM.EVENT",
    "objectType" : "Queue"
  },
  "eventType" : {
    "name" : "Perfm Event",
    "value" : 45
  },
  "eventReason" : {
    "name" : "Queue Full",
    "value" : 2053
  },
  "eventCreation" : "2016/10/21 07:11:28.58 GMT",
  "eventData" : {
    "queueMgrName" : "V9000_A",
    "baseObjectName" : "FULLEVT",
    "timeSinceReset" : 0,
    "highQueueDepth" : 4,
    "msgEnqCount" : 0,
    "msgDeqCount" : 0
  }
}
Using the program
The modified amqsevt has an extra command line option, “-o json” to indicate that the output should be in JSON. When selected, some of the status (eg program starting or ending) messages from the program are disabled, so that the only information sent to stdout are the JSON events themselves. When needed, error messages are now sent to stderr. That means that the standard output from the program can be sent directly to any JSON-aware program without needing further filtering. There is a blank line between each event if you want to split output at a convenient point.
This example uses the jq command, which is designed to filter JSON, to find which queues have hit their full depth. It reads all the events from the queue manager and waits 2 seconds for any further input (the -w parameter):
$ amqsevt -m QM1 -o json -w 2 |\
  jq 'select(.eventReason == 2053) |
     .eventData.baseObjectName ' "FULLEVT"
$
Note that the output includes the quotes around the queue name; any further processing may want to remove that. The “‘-r” option to jq will do that for you.
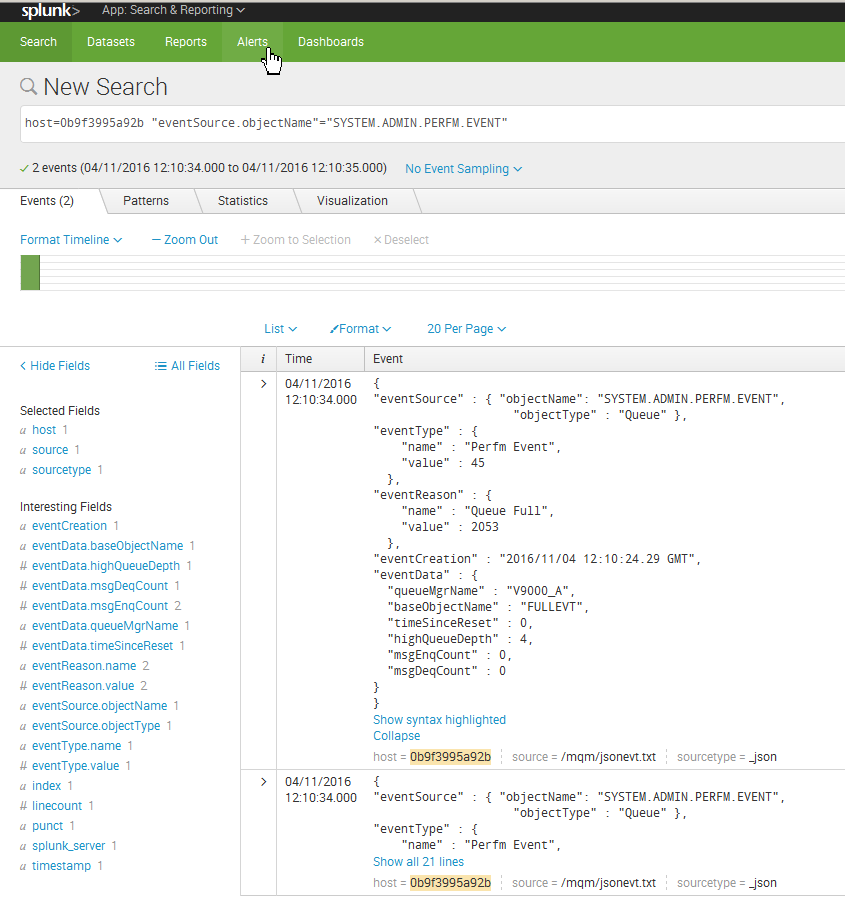
In this next example, I redirected the output to a file, and then let the Splunk monitoring product read it. Then I applied a filter to look for all events from the PERFM event queue:

Where to get the program
The modified amqsevt program was originally available from github.com as a gist, but is now included as part of the MQ samples.
This post was last updated on November 22nd, 2019 at 09:08 pm