MQ V9 added resource monitoring statistics that you can subscribe to. In this post I’m going to show how you can generate similar statistics from your own applications using the same model. For example, you may want to track how many successful and how many failed messages are being processed.
Introduction to resource statistics
Queue managers on the Distributed platforms publish many statistics about themselves and the systems they are running on. This started with MQ V8 on the Appliance, and was extended to the other platforms in V9. The fundamental concept is that a monitoring program retrieves metadata that describes the statistics from the queue manager and then subscribes to topics representing the real data. For more information about this approach, see Mark Whitlock’s post here.
Mark Bluemel then wrote an article about decoding the statistics that you can read here.
But the idea of the metadata can be extended to other components too. It does not have to apply only to queue manager internal data. I used the design to add statistics to a new component of MQ, the MQ Bridge to Salesforce that was first shipped in MQ V9.0.2. I’ve also received several questions about how these statistics work, and there seemed to be a positive reaction from an MQTC audience when I proposed writing up the approach.
So this post describes and links to some code that you can copy and extend for generating arbitrary application-specific statistics.
The model
The design for these statistics involves a three-level classification. There are Classes, Types, and Elements. It is the Element that holds the actual values that can be displayed. An element may be further qualified with a name – in the queue manager statistics, this is where you see the Queue Name being used. Both the metadata and the real values are contained in PCF messages.
When you want to add monitoring of your own applications, it is this model that you need to design first. The three tiers are a given; that cannot be changed. For some of the values I needed to generate, a design involving just two levels felt more appropriate but I had to introduce what was essentially a “padding” level in the middle. That padding used the same name and description for the Type layer as for the Class, which seemed redundant but it was the only way to follow the model.
The sample program
I’ve posted a short program that creates and describes some statistics as a gist download on Github. The statistics produced by this program are very simple – there are counts of “system level” values, and counts for some specific named objects – but it should demonstrate how it can be extended for more realistic statistics. The program includes comments to describe what is going on at each step. It uses JMS as the core messaging API, but other APIs and languages could be used. Java does make it easy to work with PCF messages, though you can see some special considerations when writing those messages via JMS to ensure correct formatting.
After connecting to the queue manager, the program builds metadata describing the classes, types and individual elements, and publishes these as retained publications. That allows monitoring programs to start up at any time and still be able to get the metadata. The metadata only needs to be published once, in this case as the program starts up. You can see the construction of the tree and the MQ messages that describe it in the publishMetaData() method. The program then continues to loop, publishing random numbers for each element.
How did I design this
There is not a huge amount of formal documentation on these resource statistics. One reason for that is the flexibility and potential for change given by the metadata approach. The best information on decoding the events is from the amqsrua sample program. I used both that program’s source code and the executable to validate what was going on. I also used the amqsevt program a lot, subscribing to the various topics and seeing both how PCF components were built and that my generated messages matched the queue manager’s construction.
Notes
There are several things to note here:
-
- The code in this sample requires at least the MQ V9.0.2 (Continuous Delivery) Java client. Previous levels had problems generating the MQCFGR structure. The fixes have not been put back into the V9.0.0.x (LTS) stream as noone else has needed them. Of course, the fixes will be in any future LTS version of MQ. If you converted the sample to C (or another language) where you control the PCF formatting more directly, then you could use older MQ client interfaces.
- Version 9.0.2 was also where changes were made to amqsrua, to allow it to subscribe to user-chosen metatopics (a new -p option). The queue manager itself does not need to be at V9.0.2 if the applications – both monitors and generators – are connected as clients.
- The queue manager makes some nice optimisations internally, such as only generating statistics when it knows there are subscribers. That is not really an option for this kind of application-level code. While it would be possible to inquire on subscribers before publishing, it is probably more efficient to always generate the numbers and just have the queue manager throw away the publications when there are no subscriber. You would probably want to have an option to define how frequently the statistics should be generated (and to disable them entirely) in your application.
- This sample program holds open a separate object handle for each topic on which it publishes. That is OK for the small number of elements used here, but you may want to think about the costs of publishing statistics and the overall topic space if your design suggests using thousands of individually named objects in the topic tree. Subscriptions can be made to wildcards in the model, although not for the standard queue manager statistics (queues must be explicitly referred to in those subscriptions).
- There is an assumption that the program generating the statistics has a unique naming model for the tree. You could not run two copies of this example program as the statistics would interfere with each other. One solution I have considered is that the “application name” in the metadata is extended for each instance of a running program to include a unique identifier. Though you would likely have to ensure that identifier was reused when the same instance was restarted. And monitoring programs that collect the data have to be configured to understand the identifier. Fortunately for my purposes, I didn’t need to do that in the Bridge to Salesforce as only one instance can run at a time on a queue manager!
- When I started decoding the queue manager’s resource events using amqsevt, I got a little confused at first because it appeared to show PCF elements referring to the ApplicationType or CodedCharSetId. In fact, that is just because the statistics events use an index number for the Element fields that happened to have the same value as the MQIA values for those parameters. There is no reason to start element identification numbers from zero (it’s not processed as an array index, but as a key in a Map). I tried to reduce that confusion in this sample program by starting the element index values from some point in the MQIA_USER_LIST range. So amqsevt now says instead that it cannot decode the number to an MQ attribute. There’s nothing wrong with the queue manager here, but you have to remember that the element values are not in any way related to the constants that you might see in other PCF events or commands.
- The queue manager resource statistics are produced only by the Distributed platforms. But there is nothing stopping application-level code using the same approach on z/OS. I have successfully run this sample program while connected to a z/OS queue manager and run monitoring programs to collect the statistics from there. You might want to introduce a suitable topic object to control security on the topic tree. There is a SYSTEM.ADMIN.TOPIC object that controls access to the $SYS/MQ tree automatically created on the Distibuted side; something similar may be useful on z/OS, but it is not essential.
Running a monitor
Here is an example of a flow through the amqsrua sample that shows the statistics created by this sample. Remember that the $SYS has to be escaped in this environment to ensure it does not get interpreted as a shell variable.
$ amqsrua -p "\$SYS/Application/DemoMQMonitor" -m QM1
SYSTEM : System Data
OBJECTS : Object Data
Enter Class selection
==> SYSTEM
T1 : Data about system resource T1
T2 : Data about system resource T2
Enter Type selection
==> T1
Publication received PutDate:20171120 PutTime:11241339 Interval:4.007 seconds
How many loops generated 41 10/sec
A random number 3 1/sec

Publication received PutDate:20171120 PutTime:11241740 Interval:4.008 seconds
How many loops generated 42 10/sec
A random number 0
And here is another example, this time collecting information about the object called ‘A’.
$ amqsrua -p "\$SYS/Application/DemoMQMonitor" -m QM1
SYSTEM : System Data
OBJECTS : Object Data
Enter Class selection
==> OBJECTS
OBJECTNAME : Object Specific Data
Enter Type selection
==> OBJECTNAME
An object name is required for Class(OBJECTS) Type(OBJECTNAME)
Enter object name
==> A
Publication received PutDate:20171120 PutTime:11251351 Interval:4.008 seconds
Successful invocations 5 1/sec
Failed invocations 16 4/sec
Total invocations 21 5/sec

Publication received PutDate:20171120 PutTime:11251752 Interval:4.008 seconds
Successful invocations 12 3/sec
Failed invocations 19 5/sec
Total invocations 31 8/sec
Other monitors
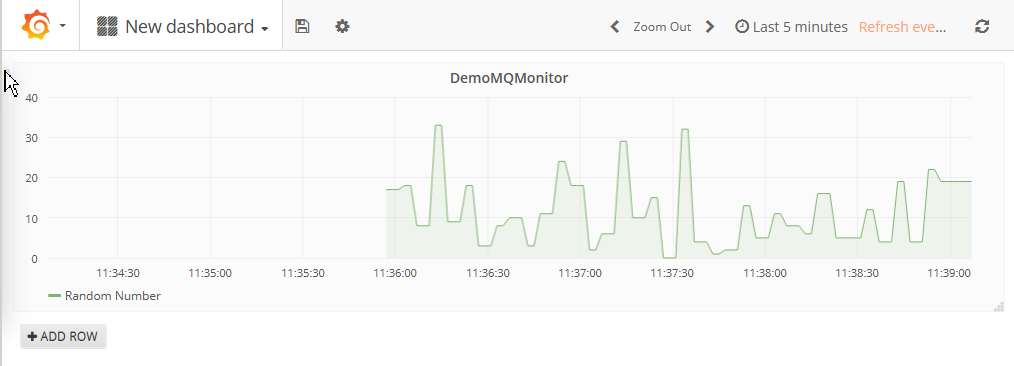
I have also updated one of the packages from the MQ Go monitoring programs here. The Prometheus package takes a “metaPrefix” parameter to allow it to monitor arbitrary topics.
This allowed me to construct a simple dashboard in Grafana that starts off looking like this:
Summary
I hope this has given you some ideas on how you might be able to extend your applications so they can be better monitored.
This post was last updated on November 19th, 2019 at 07:41 pm