It is odd how often similar questions come at the same time from unrelated places. Because of the projects and articles I’ve written about visualising MQ’s metrics in Grafana, I recently had a couple of people asking about using that same front-end but able to work with log-file data. Specifically would it be possible to use Loki and Grafana together with MQ. My immediate reaction was that I didn’t know what Loki was in this context, but clearly they couldn’t be asking about a Norse god or Marvel character. Instead after a very short search and a few minutes reading, I guessed that it ought to be possible to use it. Which was my reply.
But of course, I’m not likely to leave it there when I learn about a new tool. Especially when I have a reasonable starting point like a working local Grafana setup. And so I have done some very quick experiments to prove that the approach really can work. On the way I’ll also take a brief digression into using logrotate.
What is Loki
Loki is Grafana’s version of a log aggregation tool. It has a similar role to Elasticsearch and Splunk although its creators will naturally point out differences. Essentially it takes lines of information that you might find in product or platform status logs, stores them, and provides a way to search or dig deeper into them. As it comes from the same stable, Grafana then has access to Loki built in as a regular datasource.
Contrast that with metrics data, stored in a time-series database such as Prometheus. One store is dealing (mostly) with numbers; the other is dealing (mostly) with text.
For more information about Loki, there is a fuller introduction here.
Source data: event messages
The first thing to think about was what data might be useful and suitable for storing in Loki. I considered using MQ’s error logs for this experiment as they have an option to be written in JSON format.
But instead I decided on working with event messages. One reason for that was the hope that I could demonstrate selection based on fields such as the event type; another reason was that it’s easy to generate more test data on-demand. For example, if I’d consumed all events, a simple script could be used to force creation of configuration or queue full or authorisation events.
The amqsevt sample program, which I’ve written about before, is used to format the events. Since Loki’s ingestion process likes to work with single-line log messages, I added a call to the jq program so that the pretty-printed JSON events get transformed into single-line JSON. There are other ways to do that transform without needing another program, but it was quickest to do it that way. I also added the queue manager name into the generated output as that may be useful. Not all events contain the qmgr name; this way we can guarantee it’s always there.
The script ends up with the logs (and the script itself) in a directory called /var/mqm/events. You can see that directory used in a few places in the configuration files in this post.
Running EVENT MONITOR as a service
In my setup, the programs start along with the queue manager by defining a Service object:
DEFINE SERVICE(EVT) CONTROL(QMGR)
  SERVTYPE(SERVER)
  STARTCMD('/var/mqm/events/evt.sh')
  STARTARG(RUN +QMNAME+)
You may notice that there is no STOPCMD defined; that is for a good reason. I’ll show the actual script in a moment, after a look at logrotate.
Using logrotate
With the output from the event logging process going to a file, one worry is if that file grows forever. There has to be a way to truncate the file at some point. The logrotate program is the standard way on Linux to do that job. It has configuration rules that say how files get renamed and truncated – most commonly it keeps a small number of days worth of logfiles.
One thing I had to think about was that the output from the event logger gets streamed continuously to its file by redirection. If logrotate simply renames the file, the output file handle may not get reset and amqsevt will still write to the renamed file. To ensure that doesn’t happen, I configured the process to forcibly reset the logging by killing and restarting the event monitor. It might not be necessary in all circumstances but I felt it was needed for safety.
Configuration for the rotation process comes from files typically stored in the /etc/logrotate.d directory – one configuration file for each kind of log to be processed. I created /etc/logrotate.d/ibmmq:
/var/mqm/events/*log {
  rotate 3
  daily
  missingok
  notifempty
  sharedscripts
  nocompress
  prerotate
    /var/mqm/events/evt.sh STOP QM1 > /dev/null 2>/dev/null || true
  endscript
  postrotate
    su mqm -c "/var/mqm/events/evt.sh START QM1" > /dev/null 2>/dev/null || true
  endscript
 }
As part of the process, scripts can be called before and after the files are actually moved or modified. I used the same script to forcibly kill amqsevt capturing the events, and then to restart it after logrotate has done its job.
The service control script
This is the script that I used to manage the process. As well as a queue manager name, there are 3 control options: STOP kills the amqsevt program and then waits a while, to ensure the queue manager notices that it has gone (as it uses exclusive access to queues by default, it can’t be restarted immediately after a kill); START uses the START SERVICE to restart the program; RUN is what the queue manager calls as the Service actually starts.
!/bin/sh
# /var/mqm/events/evt.sh is called from the SERVICE object and
# the logrotate processing

evDir=/var/mqm/events

cmd="$1"
if [ -z "$2" ]
then
  echo "No qmgr name supplied"
  exit 1
else
  qm=$2
fi

. /opt/mqm/bin/setmqenv -k -m $qm

if [ "$cmd" = "RUN" ]
 then
   # This is the real command to format the logs
   # Add the qmgr name to the evt output
   $MQ_INSTALLATION_PATH/samp/bin/amqsevt -o json -m $qm    |\
     jq --unbuffered --arg qm $qm -c '.eventSource += {queueMgrName: $qm}' > $evDir/$qm.log
 elif [ "$cmd" = "START" ]
 then
   # This uses the MQ Service to kick off the script in RUN mode
   echo "START SERVICE(EVT)" | runmqsc $qm
 elif [ "$cmd" = "STOP" ]
 then
   # We need to stop the program. But we may not be running with the same
   # id as when it was started.
   pid=`ps -ef|grep amqsevt|grep "\-m $qm"|grep -v grep| awk '{print $2}'`
   echo Found process: $pid
   killed=false
   if [ ! -z "$pid"  ]
   then
     # Check we're not about to kill anything important!
     if [ $pid -gt 1 ]
     then
       if [ `whoami` = "root" ]
       then
         kill $pid
       else
         sudo kill $pid
       fi
       if [ $? -eq 0 ]
       then
         killed=true
       fi
     fi
   fi
   if $killed
   then
     # We successfully tried to stop it
     # Give the program a chance to be recognised as dead
     sleep 30
   fi
else
  echo "Unrecognised command"
  exit 1
fi
Logrotate security
When I set up the logrotate configuration, there was one piece of security management that I expected – as it runs under a root id, I needed the su mqm operation to be able to run runmqsc which in turn restarts the service. Part of the complexity of the evt.sh script is because different modes of operation may be running with different privileges.
But I also found an unexpected issue – logrotate is the first program I’ve explicitly and knowingly used that hooks into the SELinux security framework. The first time the system scheduled logrotate to execute, it failed on the ibmmq configuration file. Errors showed up in the system journal:
SELinux has prevented the logrotate process, running in context logrotate_t, access to the QM1.log file.
Doing various searches, I found solutions to this which involved setting specific SELinux permissions on files which are not in logrotate’s default directories.
semanage fcontext -a -t var_log_t /var/mqm/events/\.*
restorecon -v /var/mqm/events/*
But even that was not quite enough, as the rotation process also needed access to runmqsc and the script itself. Since that wasn’t the main purpose of the activity, I ended up giving the logrotate process more privileges than perhaps it should have. Maybe this is something to come back to in a future blog post. This command removes the need for specific SELinux customisation:
semanage permissive -a logrotate_t
Even with the global permission setting, you may still see warnings in the system journal from the auditing subsystem but those should not affect things actually getting done.
For more information on setting up logrotate in an SELinux environment, you can read this page.
Running loki and promtail as containers
Just as storing metrics data is usually built around two pieces of technology – the specific collector/exporter and the database – the same applies for the log storage. In this case we have loki as the storage mechanism, and promtail as a program that actually reads the log files and pushes the contents to the database.
Both are available pre-packaged as container images from Dockerhub that you can run directly. The loki image did not need any customisation at all; the promtail container needed configuration to tell it which logs to read. Apart from that, the default options were good enough. For simplicity, I tend to run containers using docker directly and sharing the host’s network. You might prefer to use docker-compose to coordinate the images and do a bit more network isolation, but that tends to need firewall configurations too. And given current practical difficulties I didn’t want to get my Linux system into a state where I would have to go into the office to reboot it if it all went wrong.
The promtail image gets started with both the configuration file and the MQ event logs mounted into it.
cfDir=~/containers/loki
docker run --network=host --detach grafana/loki
docker run --network=host --detach \
        -v $cfDir/prom.yml:/etc/promtail/config.yml \
        -v /var/mqm/events:/var/mqm/events \
        grafana/promtail
The promtail configuration file, stored on the host machine as prom.yml and mounted into the container, is fairly simple. The only thing it is going to be capturing are the MQ events. But one special thing here is to use the pipeline processing to extract the event creation time, and make sure that is used in Loki rather than the default value – the ingestion time. As always with YAML files you have to be careful about spacing in these files – it’s not always obvious when you get a syntax error in there.
server:
   http_listen_port: 9080
   grpc_listen_port: 0
   log_level: debug

positions:
   filename: /tmp/positions.yaml

clients:
   - url: http://localhost:3100/loki/api/v1/push

scrape_configs:
- job_name: ibmmq
  pipeline_stages:
  - json:
      expressions:
        timestamp: eventCreation.epoch
  - timestamp:
      source: timestamp
      format: Unix
  static_configs:
  - targets:
    - localhost
   labels:
     job: mqevents
     __path__: /var/mqm/events/*log
Alternative approach for promtail
An alternative to this mechanism would be to combine promtail in the same container or host system as the amqsevt and jq programs (either put amqsevt and the MQ client runtime into promtail’s container, or install promtail into the host operating system). With that, the output from amqsevt and jq can be piped directly into promtail using its --stdinoption. That would avoid any intermediate files and messing about with logrotate. Though remember that if you are already deploying promtail into machine images in order to pick up system logs, then you cannot also use the same daemon with the stdin piping – you’d have to run a second instance directly.
Logs in Grafana
By this point, we have the MQ events being captured and formatted to a log file, that log file being read by promtail and pushed into loki. The next phase is to look at, and search in the logs using Grafana.
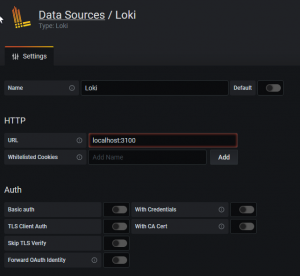
Grafana has a number of built-in datasource types. One of those is Loki, so we have to add that as an actual datasource. Everything is running on the same box for me, so that’s easy.
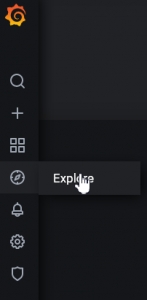
It’s then possible to start looking at the log data. Use the “Explore” option.
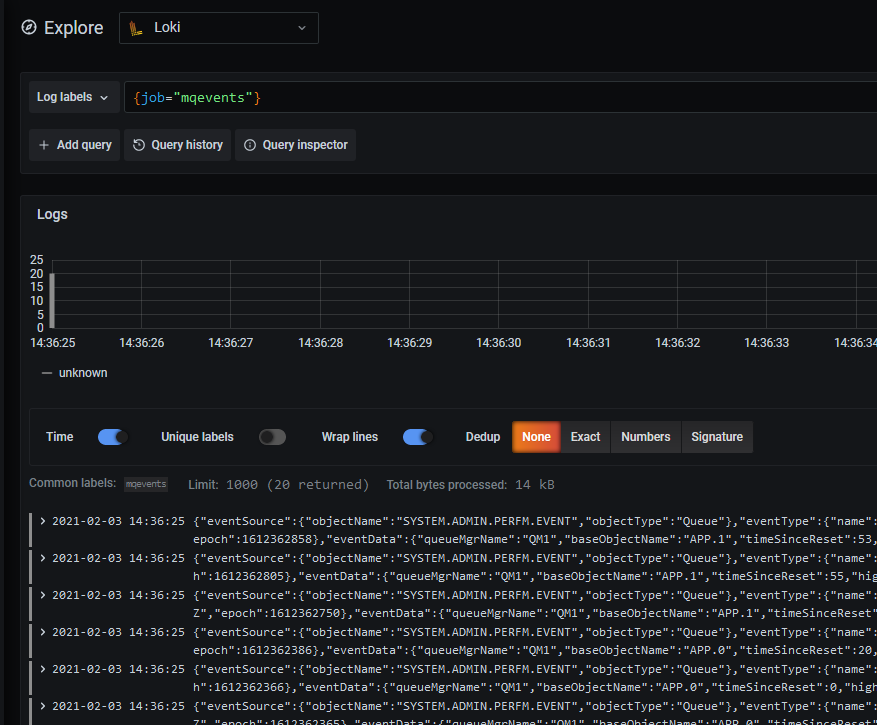
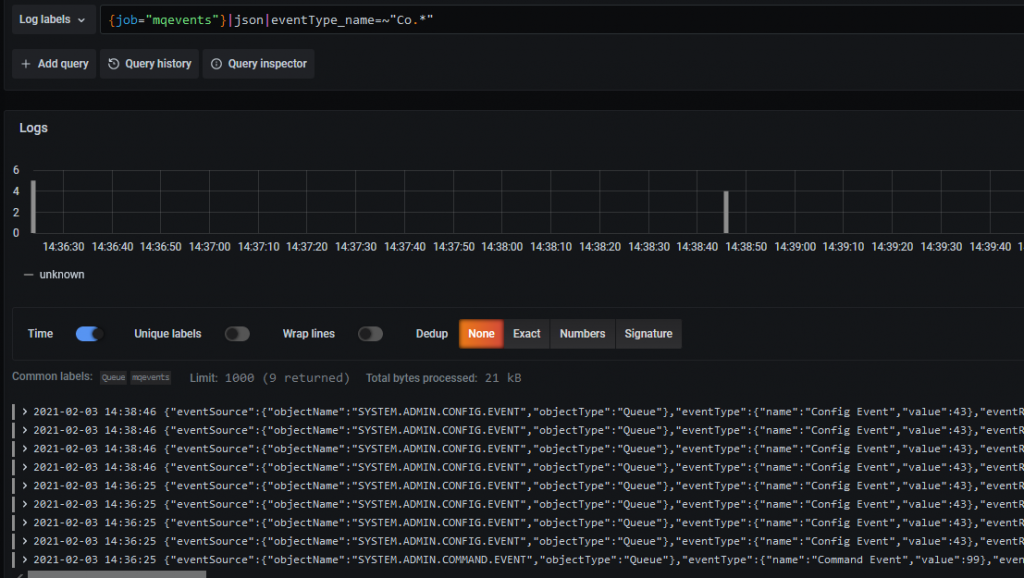
Then select the mqevents job. The jobname was part of the promtail configuration. And you can now see all of the events loaded into Loki.
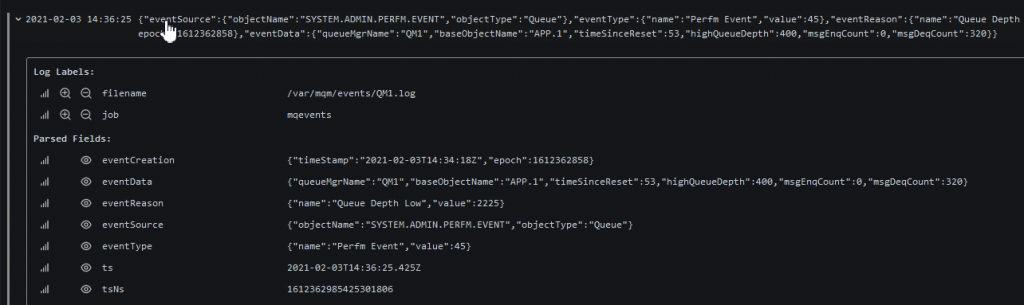
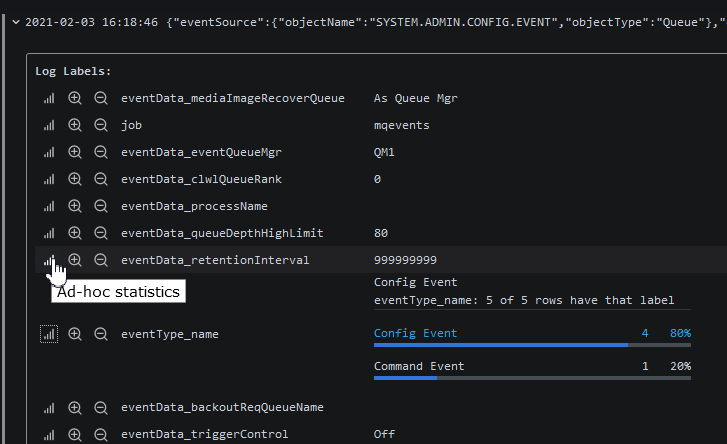
Clicking one of the events shows it in more detail:
Next, I’m going to filter the logs a bit. The query syntax used by Loki turns JSON fields into strings with underscores separating the fields instead of the more usual dots. So now I’m going to look for just the Config and Command events. Which conveniently start with the same characters so a regex can be used in the filter. The query I used, and which can be seen on the top line of the Explore window is:
{job="mqevents"}|json|eventType_name=~"Co.*"
And that reduces the selection:
How many of these events are Config and how many Command? That can be found by selecting one of the events and asking for filtering statistics.
Extension Possibilities
From here, you should be able to see how this might be useful. There are many more filtering and calculation options available within Grafana, Loki and their query languages. And perhaps add some of those reports to a common dashboard along with the other metrics.
Using it with error logs
Processing the MQ error (“diagnostic service”) logs might actually be a bit easier than working with the event formatting. The JSON format is already a single line (no need for the jq filter program); and because the error log files are not held permanently open by the queue manager, the stop/restart processing I needed here is not required. You would probably just want to monitor AMQERR01.json (in both the system and all the qmgr directories) as the wrapping and rotation is handled by MQ, with all new entries going to that first logfile.
Summary
I hope this has shown how you can use these Open Source tools to work with the non-metric data that MQ produces. Please let me know if you have found it useful, or if you have any additional ideas.
CHANGE HISTORY
2021-02-09 Added qmgr name to all events via a jq script
This post was last updated on February 9th, 2021 at 02:37 pm
Thanks Mark, this is great info and I look forward to working with your examples..