One of the focus areas for new development in MQ in recent years has been in the area of High Availability and Disaster Recovery. Technologies such as RDQM and Native HA, and automatically managed logfiles, give a range of possibilities for ensuring your messaging systems continue reliably. Alongside the core function, there are also metrics and status information to show more about what is going on. And so the latest updates to the open source monitor programs add collection of some of these recently-added values. This should simplify monitoring MQ availability.
Queue Manager Hostname
One piece of information that I’ve seen people ask for regularly is “where is my queue manager running?” Perhaps surprisingly, that’s not been something that we reliably knew.
A queue manager might run on several different machines, depending on how failover configurations are managed. And application programs do not necessarily know the location, as a client connection could point at multiple different systems and no value comes back to say which system is successful. There is a field in the Queue Manager Active event message, though if you are not capturing and analysing those, you could miss it.
But the latest product version, MQ 9.3.2, adds the current hostname – assuming you have not explicitly overridden it by setting the MQS_IPC_HOST environment variable – to the Distributed platform’s DISPLAY QMSTATUS command:
     1 : dis qmstatus all
AMQ8705I: Display Queue Manager Status Details.
   QMNAME(QMLL)                  TYPE(QMGR)
   STATUS(RUNNING)               ARCHLOG( )
   ARCHSZ(0)                     AUTOCLUS(NONE)
   CHINIT(RUNNING)               CMDSERV(RUNNING)
   CONNS(25)                     CURRLOG(S0000003.LOG)
   DATFSSZ(SHARED)               DATFSUSE(SHARED)
   DATPATH(/var/mqm/qmgrs/QMLL)  HOSTNAME(machine1)
   INSTANCE( )                   INSTDESC( )
   INSTNAME(Installation1)       INSTPATH(/opt/mqm)
   LDAPCONN(INACTIVE)            LOGEXTSZ(66)
   LOGFSSZ(SHARED)               LOGFSUSE(SHARED)
   LOGINUSE(44)                  LOGPATH(/var/mqm/log/QMLL/active/)
   LOGPRIM(3)                    LOGSEC(2)
   LOGSTRDA(2023-02-03)          LOGSTRL(<0:0:10:61190>)
   LOGSTRTI(09:47:51)            LOGTYPE(LINEAR)
   LOGUTIL(45)                   MEDIALOG(S0000000.LOG)
   MEDIASZ(1)                    QMFSSZ(952828)
   QMFSUSE(11)                   QUORUM( )
   RECLOG(S0000002.LOG)          RECSZ(1)
   REUSESZ(0)                    STANDBY(NOPERMIT)
   STARTDA(2023-02-03)           STARTTI(09.47.52)
   UNICLUS( )
That attribute now appears as a tag or label in the collector programs, so we can display it alongside the queue manager name. (The description was also recently added as a label, in response to a user request.)

Logger Metrics
We have added some further information to the status output. In the above MQSC output, you can see the CURRLOG, MEDIALOG and RECLOG values. And the screenshot shows them in a status table for the queue manager.
The values show which logfiles are needed for different types of recovery. The metrics collector transforms the filename into a simple number, to make it easier to work with – S0000002.LOG shows up as the simpler integer2 which fits better for graphs and tables. A large difference between the current log and one of the recovery files might indicate a problem to investigate – perhaps you have a long-running transaction or you need to run rcdmqimg more frequently.
Some logging information already appeared through the published metrics, but the filenames are new.
Native HA metrics
The queue manager also publishes metrics about the Native HA status:
$ amqsrua -m NHA -c NHAREPLICA -t REPLICATION -o '#'
Publication received PutDate:20230203 PutTime:10174253 Interval:4.569 seconds
inst3  Synchronous log bytes sent 56630 12393/sec
inst3  Catch-up log bytes sent 0
inst3  Log write average acknowledgement latency 172083 uSec
inst3  Log write average acknowledgement size 2201
inst3  Backlog bytes 3016
inst3  Backlog average bytes 2141

Publication received PutDate:20230203 PutTime:10174253 Interval:4.569 seconds
inst2  Synchronous log bytes sent 56630 12393/sec
inst2  Catch-up log bytes sent 0
inst2  Log write average acknowledgement latency 171910 uSec
inst2  Log write average acknowledgement size 2165
inst2  Backlog bytes 3016
inst2  Backlog average bytes 2141
These metrics come out for each of the replica instances. In this example, inst1 is the active instance, so is not in the output. While inst2 and inst3 are the replicas. Unlike subscriptions for queue metrics, the NativeHA topics take a wildcard for the object name. And this is the expected way to use them, so you do not need to know about the replica instances or when they change after a failover.
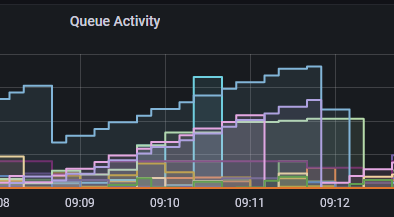
These metrics are captured and reported, for example to Prometheus. The metrics have the nhaelement in the name. Here is a graphical display of the ibmmq_nha_backlog_average_bytes metric:
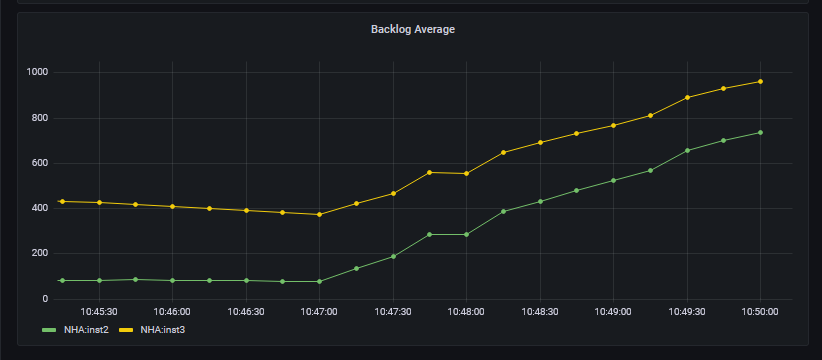
Tags on the metrics show the replica instance names. If I kill the active instance, you can see a change in the graph (note the changed Y-axis scale):
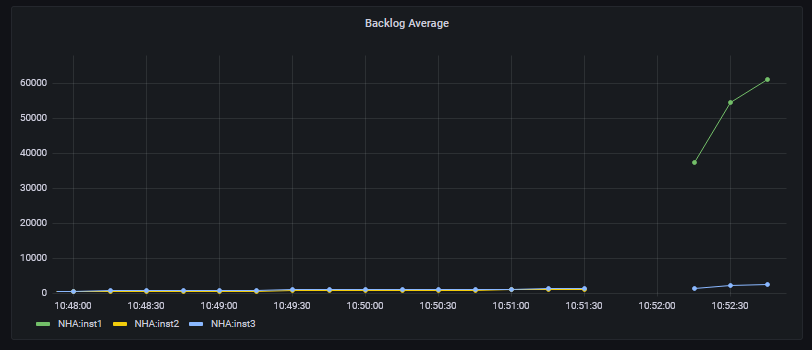
In this picture, you can see a gap while the collector reestablishes its connection to the newly-active instance. And then it reports on the revised set of replicas. Since inst1is down, the backlog is increasing to that system, while inst3 is still keeping up. The metrics for inst2stop appearing after it has become the active instance; they still show for a short time in the historic graph from when it was the replica, before it automatically took over control.
After restarting inst1 as a replica, the backlog average starts to decrease.
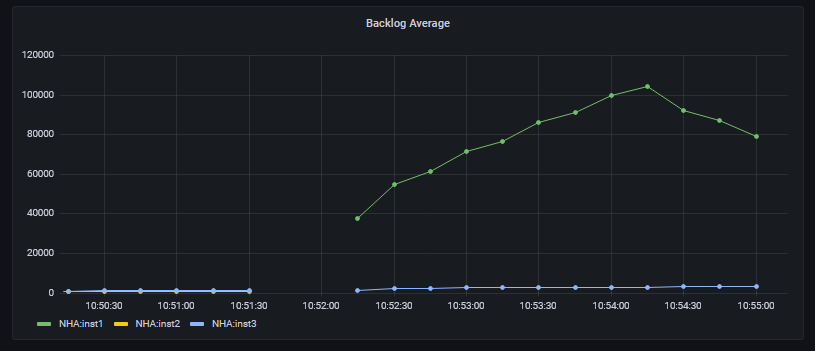
Since this particular number is an average value, it takes a little while to get back to zero but you can still see the immediate decrease once inst1comes back into communication with the active instance. There is a separate metric for the exact current backlog if you don’t want to look at the average.
Collector Reconnection
Depending on how you have configured the collector, it may automatically reconnect to the alternate instance after a failover. For example, using a client channel with DEFRECON enabled. Or running the collector as a queue manager service. The Prometheus collector also has its own reconnect logic, to deal with the database’s “pull” model for collection, though the other backend collectors do not.
If reconnection cannot be done automatically, then you would need a procedure to restart the collector after a failure/failover.
Example Dashboard
There is a model dashboard – “Logging” – in the cmd/mq_prometheus directory of the GitHub repository. You can import that to Grafana to see more about the structure of the available metrics.
Summary
Having a queue manager automatically recover from various types of failures is critical to reliability. But you also ought to keep track of the status, to see if you need to take any other actions. Adding these metrics to monitoring programs ought to help with that.
This post was last updated on February 22nd, 2023 at 10:30 am
Thanks for the content update Mark. The help you give is very appreciated.