OpenTelemetry (OTel) tracing relies on context being propagated from one component in an application stack to another. While IBM MQ does have some ability to carry that context with messages, the OTel SDK design does not make that flow automatic. This post shows how we can extract the context for some applications, and then use OTel context propagation techniques to improve the observability of applications using MQ.
In particular in this post, I’ll talk about applications using MQ with the Node.js and Go interfaces.
Introduction
OTel distributed tracing consists of two key elements:
- A span, which refers to a single operation. Spans have attributes or properties describing the operation in detail.
- A trace, which is a collection of spans representing an entire application request or transaction
Each span can refer to a “parent” span, allowing tools to build a picture of the overall flow. You might then use the data for viewing transaction volumes, response times, bottleneck discovery etc.
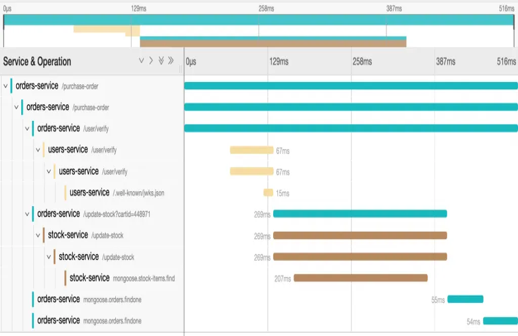
The propagation model for MQ
When applications use HTTP/REST calls to invoke another part of the processing, then state can be carried in HTTP headers. When messages are used to flow between different parts of an “application”, there is no direct stack or synchronous communication that can carry the state information. The closest equivalent of an HTTP header is a property carried along with the message. And specifically for IBM MQ, message properties are used. Properties (or the MQRFH2 structure equivalent content) can say what the current traceid, span and state are. There are agreed W3C standards for the name and format of these as HTTP Headers; they are also followed for the message properties.
The MQ Tracing exit adds and reports on spans as messages flow through an MQ network. You can see the queue managers and channels through which the messages pass. And if the message already contains the right properties, then it also shows the relationship to the rest of the application activity.
But the tricky piece is getting the “right properties” into the message in the first place. If you are using ACE, then it has been coded to insert those properties. MQ messages coming out of an ACE flow can have the traceparent and tracestateproperties automatically inserted.
If you are not using ACE, then additional work has to be done – either by your application or by OTel instrumentation.
Instrumenting Applications
There are different ways of adding the OTel tracing instrumentation, depending on your application programming language, and the frameworks in use. In many cases, OTel libraries or packages can be automatically applied.
For example, if you have a Node.js web-based application that is also using AMQP, then you can add OTel tracing without any real application code changes. Just apply an additional startup module to the app. Something like:
const sdk = new opentelemetry.NodeSDK({
    spanProcessor: new SimpleSpanProcessor(exporter),
    instrumentations: [
        new AmqplibInstrumentation(),
        new HttpInstrumentation(),
        new ExpressInstrumentation()
    ],
    serviceName: process.env['OTEL_SERVICE_NAME']
});
sdk.start();
And run the program normally but with this module added first. Something like
node --require trace_startup.js my_program.js
For other languages, you might have to modify the application. Go programs, for example, cannot currently be automatically instrumented. You have to modify the applications to use “wrappers” to your standard framework packages. That can be relatively easy (though still not “free”) if you are using packages that someone has already written such a wrapper for. It’s more work for you when packages without that existing work are needed.
Restrictions
One problem with the OTel-provided SDK libraries is that they do not work across languages in the same process. Some of the discussion linked from that issue seems to have disappeared, but it was clear that this was not a problem OTel were going to solve.
But of course, many applications mix languages. In particular they often call out to C or C++ “native” libraries. If those C modules have activity that you want to monitor in OTel tracing, they cannot automatically see existing trace/span information created in a parent Go or Python or JavaScript environment. And vice versa. There has to be custom code to propagate the context across the language boundaries.
The MQ language binding enhancements
Alongside the MQ 9.4.1 release, I’ve created instrumentation packages for both the Go and the Node.js MQI language interfaces. Since both are based on top of the MQ C library, they fall foul of the OTel cross-language restriction. They have to use the application-native OTel SDK capabilities and use the MQI to manage message properties.
The packages work in essentially the same way, although enablement is slightly different. In fact, I started with the Node version and then did an almost line-by-line conversion to the Go variant. It meant that even the source code comments started as identical!
One key decision I made was that this instrumentation would act purely as a propagator or transformer, to move the context into and out of MQ messages. There is no extra span emitted corresponding to the cross-language flow. That did not feel necessary as the layer is relatively thin and does not take huge amounts of time.
Another decision was not to try to transport “baggage” – an OTel concept of additional metadata carried around with the context. That can potentially get large, so I’ve ignored it for now.
The common model
For outbound messages (MQPUT), the binding looks to see if there is an active OTel trace. If so, it takes the context details and inserts message properties to represent them. If the message already has those properties – perhaps inserted by something else similar to the ACE flows – then they are left alone. The context then passes through the MQ network before being consumed.
For inbound messages (MQGET or Callback), the binding looks for those context properties in the message. If it finds them, and it also finds that there is an active span/trace in the application process, it creates a link from the active span to that context. So you can see the relationships. If there is no active span, then the message context is ignored as there’s nothing it can be associated with.
Message Properties and MQRFH2
In both cases, the binding does its best to cope with messages and applications that are using either message properties or the equivalent MQRFH2 folders. Inbound messages, in particular, may arrive in either style depending on the queue’s PROPCTL attribute and the MQGMO_PROPERTIES_* options set in the application.
Because properties are being added, and because we don’t know exactly what the application is capable of, there may be times that an unexpected RFH2 is visible. One assumption I’ve made is that applications should not be surprised by additional message properties (accessible by the MQCRTMH family of calls) or by additional properties in an RFH2 if that is how they receive messages. If the applications want to explicitly look at the context properties, then they can.
One reason that applications may be interested in those properties is so that they can create new spans referencing the original context. For example, if your application is sending responses to inbound requests, it might wish to maintain the overall trace context. Creating a new span that uses that context, and copying the properties from the request to the outbound response message would be a good way to do that.
So we only need to consider further the case where those properties are the ONLY contents of an RFH2, and the application is not expecting anything.
The RemoveRFH2 option
To deal with that, I’ve added a RemoveRFH2 option to an OTel-specific piece of the MQGMO and MQPMO structures – set it to true and any RFH2 is completely removed before returning a message to the application. Setting PROPCTL=NONEon the queue is not necessarily a good idea, as it might mean those properties are not available at all to the wrapper layer for context linkage. These extensions to the MQGMO and MQPMO are not part of the official MQI, but they seemed an appropriate place to add the options.
Node.js applications
The OTel integration is always available for any application using version 2.1.1 of the ibmmq package from npm. If you are not using OTel, then there is no interference with existing behaviour. The package checks to see if OTel is active, and only does real work if it finds those packages are already in use in your application.
For that reason, I’ve not listed the OTel libraries as explicit dependencies of the ibmmqpackage. They would be dependencies of your application which can be discovered and used if needed.
The only new feature of the MQI that the package exposes is an OtelOptsobject. That is made part of the GMO and PMO structure for this binding (not the real C MQI). Use of this object is completely optional, to further control the RemoveRFH2 option discussed above.
Go applications
Go applications cannot be automatically instrumented (for now). You have to write something in your application to get OTel tracing working. So the design I chose here was for a separate package, though part of the same module as the core MQI package. The go.mod file for your application refers to the overall MQ module along with the OTel libraries:
module main

go 1.22.6

require (
  github.com/ibm-messaging/mq-golang/v5 v5.6.1
  go.opentelemetry.io/contrib/instrumentation/net/http/otelhttp v0.54.0
  go.opentelemetry.io/otel v1.29.0
  go.opentelemetry.io/otel/exporters/otlp/otlptrace/otlptracegrpc v1.29.0
  go.opentelemetry.io/otel/sdk v1.29.0
  go.opentelemetry.io/otel/trace v1.29.0
  google.golang.org/grpc v1.65.0
)
You can also see how a very recent Go compiler is needed. The OTel team are very (and, I’d suggest, unnecessarily) aggressive about moving forward with their version prereqs. But we have to follow their decisions.
The application then has to opt in to using the MQ Otel package. Firstly with the packages it’s going to use:
package main

import (
  "context"
  "errors"
  "fmt"
  "net"
  "net/http"
  "os"
  "os/signal"

  "go.opentelemetry.io/contrib/instrumentation/net/http/otelhttp"
  ... and any other otel packages your app needs

  mq "github.com/ibm-messaging/mq-golang/v5/ibmmq"
  mqotel "github.com/ibm-messaging/mq-golang/v5/ibmmqotel"
)
And it must then call the mqotel.Setup() function to insert the relevant interceptors early in the application. Similar to how it would have to call any initialisation or configuration functions for the OTel exporters.
One difference between Go and Node.js in the OTel SDKs is the use of an application context (not the same as the Trace context). In Node.js, there is an implicit context that the SDKs work with; in Go, the context is a parameter passed to many of the SDK functions directly. So that has to be made available through the MQI. As we already needed the RemoveRFH2option, the Context has also been added to the GMO and PMO structures.
...
pmo.Options = ibmmq.MQPMO_NO_SYNCPOINT
pmo.OtelOpts.Context = req.Context() // "req" is part of the http request flow
If you do not set the Context, then we will probably be unable to find any active trace/span details. Everywhere you use one of those structures to send or consume messages, you should set this Contextparameter.
Java/JMS applications
Integrations already exist to automatically insert properties in JMS applications. Since the MQ JMS client is Java all the way down, it does not have the same OTel cross-language issues. So I didn’t think anything more was needed. But I’ve ended up writing about it anyway.
C/C++ applications
These will be the topic of a separate future article.
Other languages
Could interfaces be developed for other languages? And what if IBM does not own or control the MQ interface package for that language. In theory it would be possible to handle those environments, but part of the the solution would require looking at how to make that available.
It might require submissions via the opentelemetry-<language>-contrib repositories. They are where many of the instrumentation components are distributed, whether for automatic or manual processing. I chose not to do that for the Go and Node.js bindings. It was much simpler to make the necessary internal changes to hook the OTel processing into the mainline code.
And I can foresee difficulties working with the OTel-owned repos because of needing an MQ environment as part of their integration testing. Again, not impossible to solve, but not as easy as we’d like.
Integration with Instana’s MQ Tracing Exit
Once the messages properties exist in the MQ message, then the MQ Tracing Exit recognises them and creates the necessary parent relationships. If you do not have that exit on your queue managers, then the application context still flows successfully from producer to consumer. You just miss out on reports of the channel/network aspects of the message transmission.
The most common deployments of this exit are for it to run inside the SVRCONN proxy at the queue manager; it does not (and cannot) run inside MQ C client libraries. So the exit-generated spans start from the arrival of an MQ verb at the queue manager end of the channel; the client and network “cost” is reported via any parent spans.
Examples
For both my Go and Node.js testing, I started with the corresponding roll-dice applications shown here and here. I then replaced the dice rolling with code to PUT and GET messages. So there are programs acting as very simple web servers, which I could poke with curl to interact with MQ.
I also configured my MQ environment with the MQ Tracing (Instana) exit. A simple network of queues and channels routed the messages around. Everything reports directly to Jaeger using the OTLP/gRPC protocol, with a Grafana front-end to visualise things. One queue manager also had a “delay” exit, simply to introduce some randomness to the flows. Otherwise things went too quickly and consistently to show up in graphs.
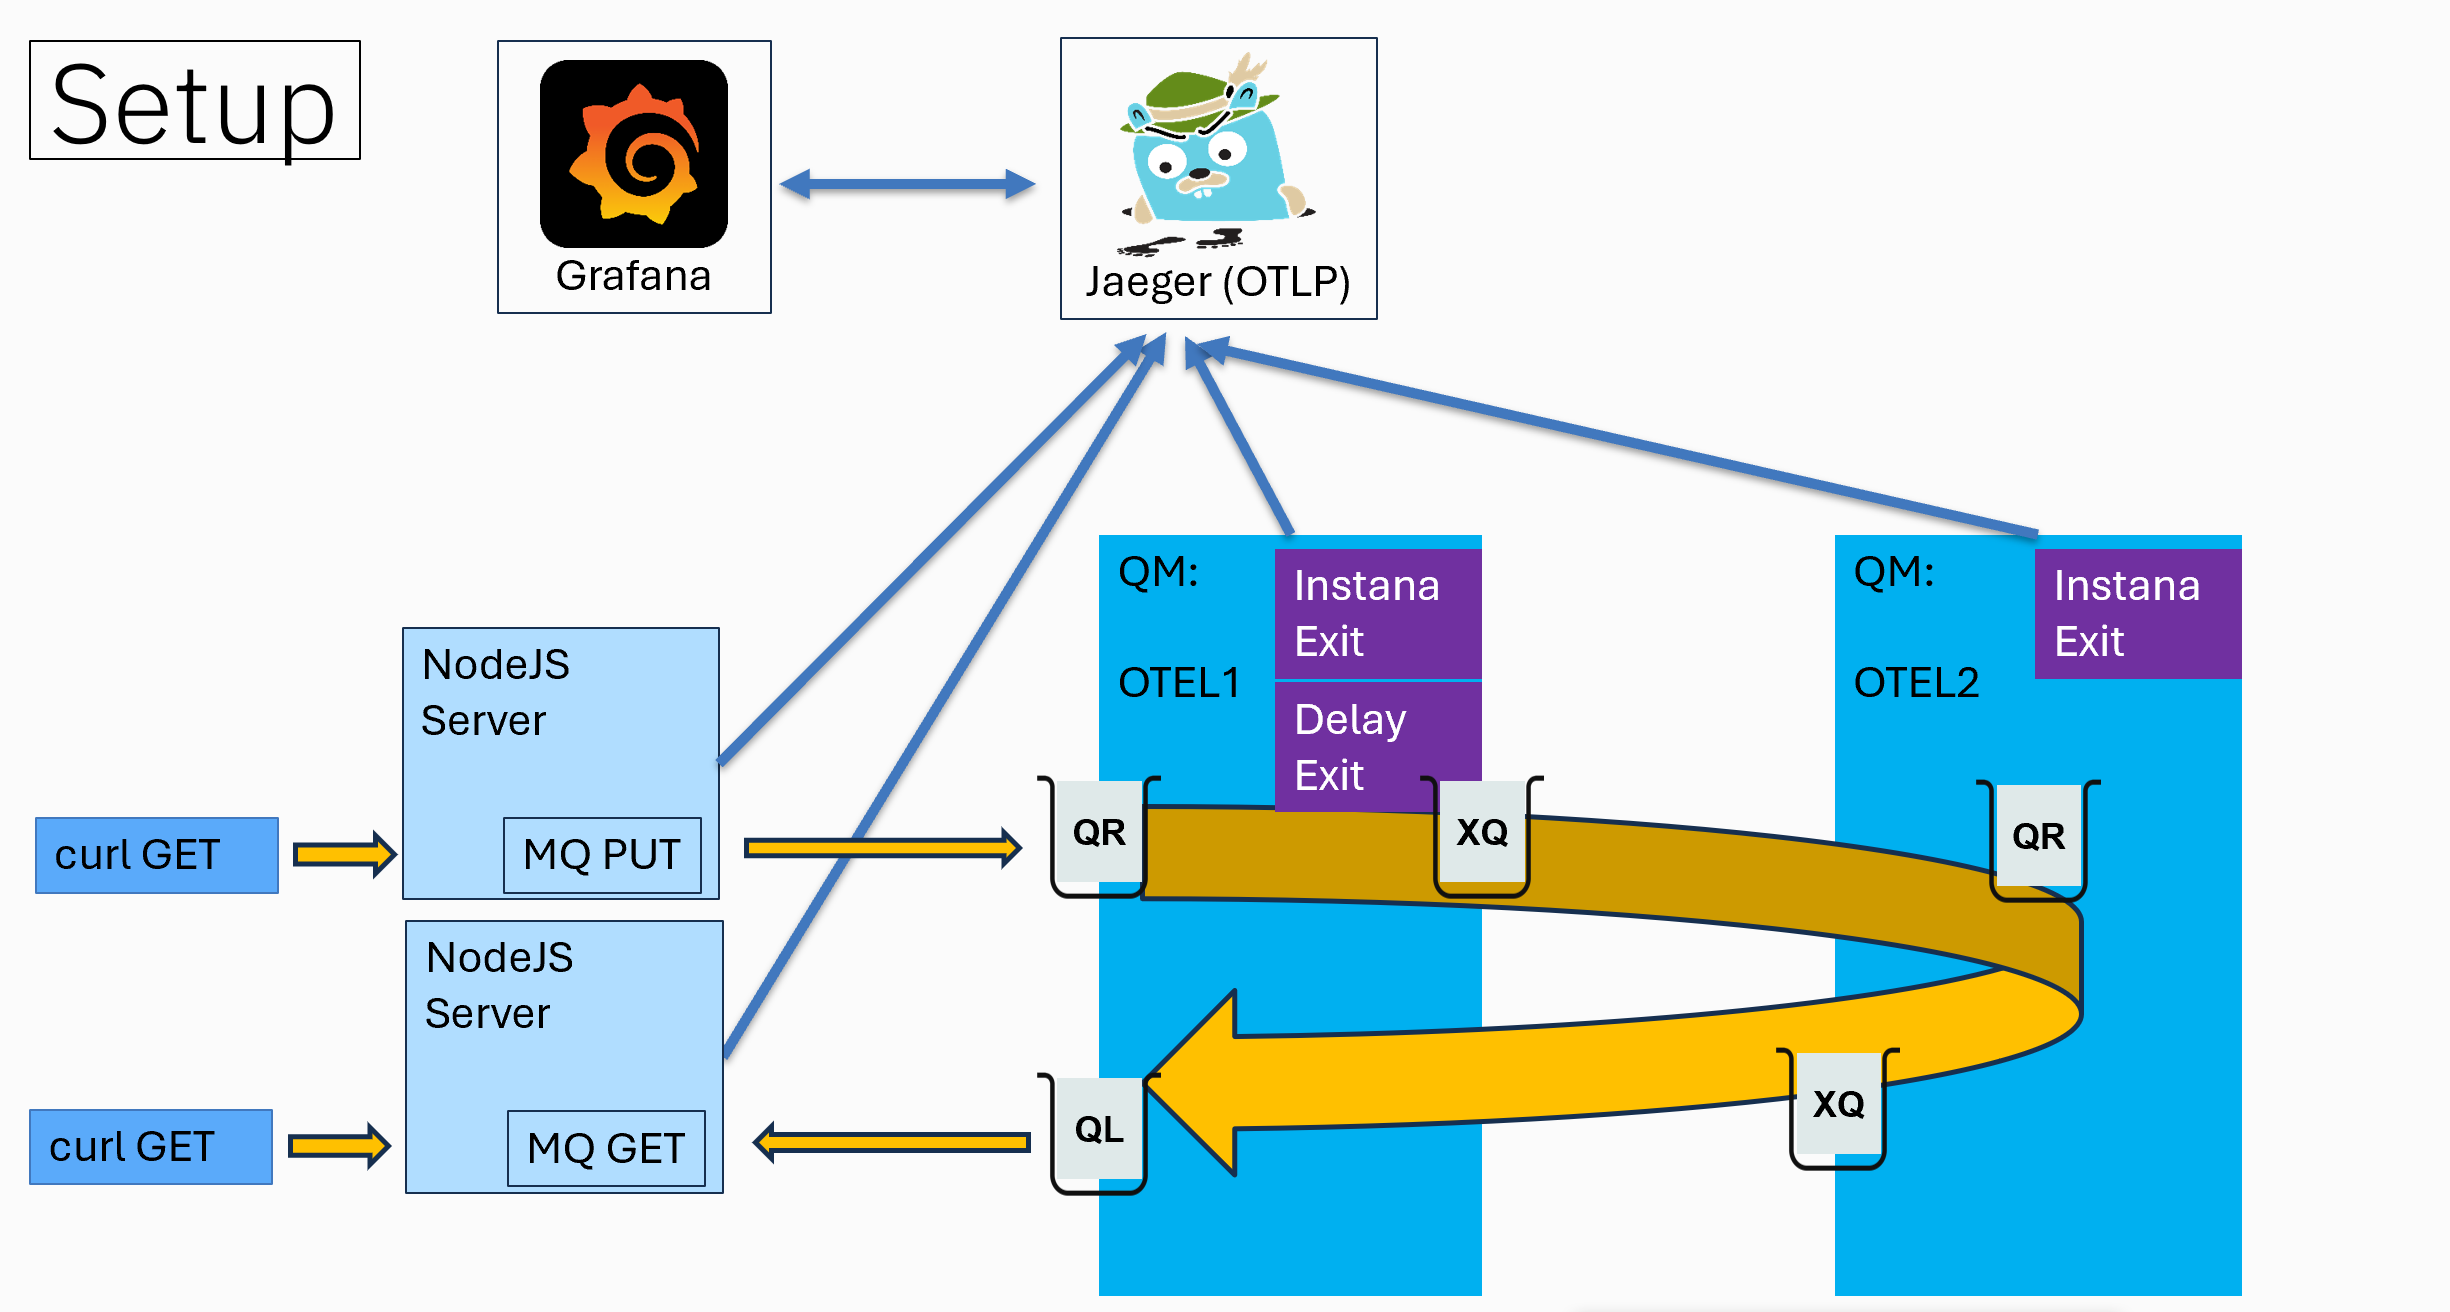
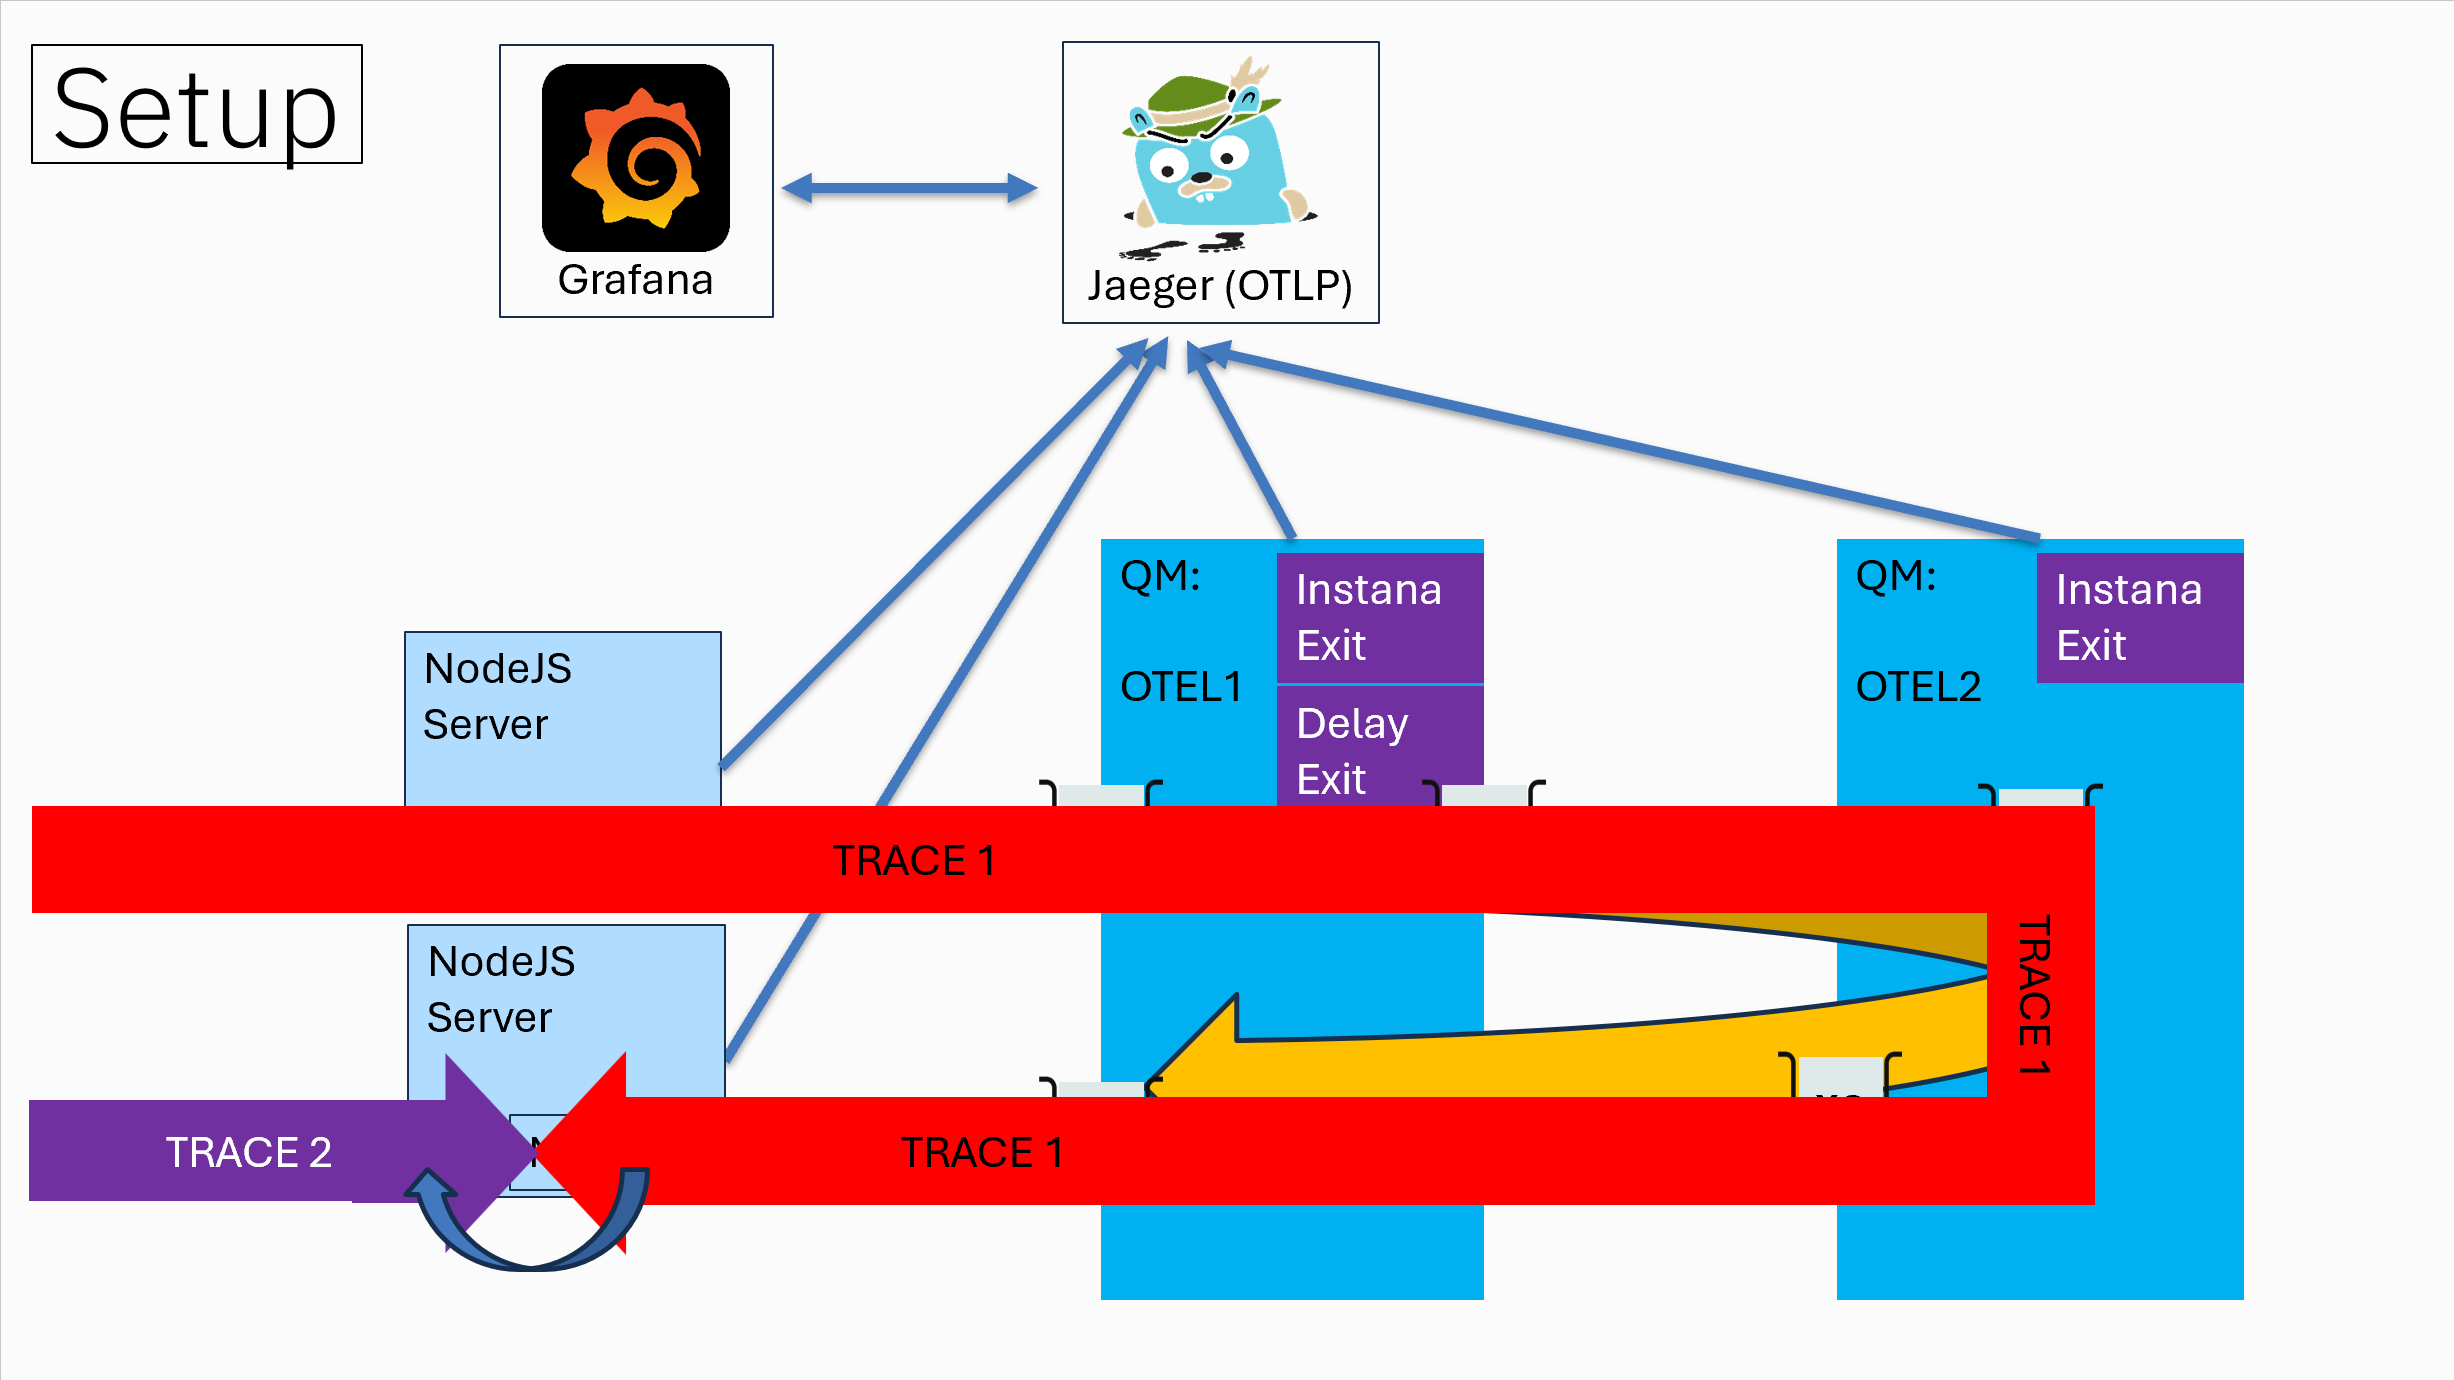
We expect to see two traces. One covers the process causing a message to be put, along with the path it takes through the MQ network; one covers the process causing a message to be received. With a link between them:
Results
And that is what we do indeed see. Starting with a Grafana dashboard showing several of the “Trace 1” flows, and their duration and distribution.
Where the root trace name includes “GET”, it refers to the HTTP GET that kicked off the flow. It’s not an MQGET. Though the GETs lower down are MQGETs from transmission queues.
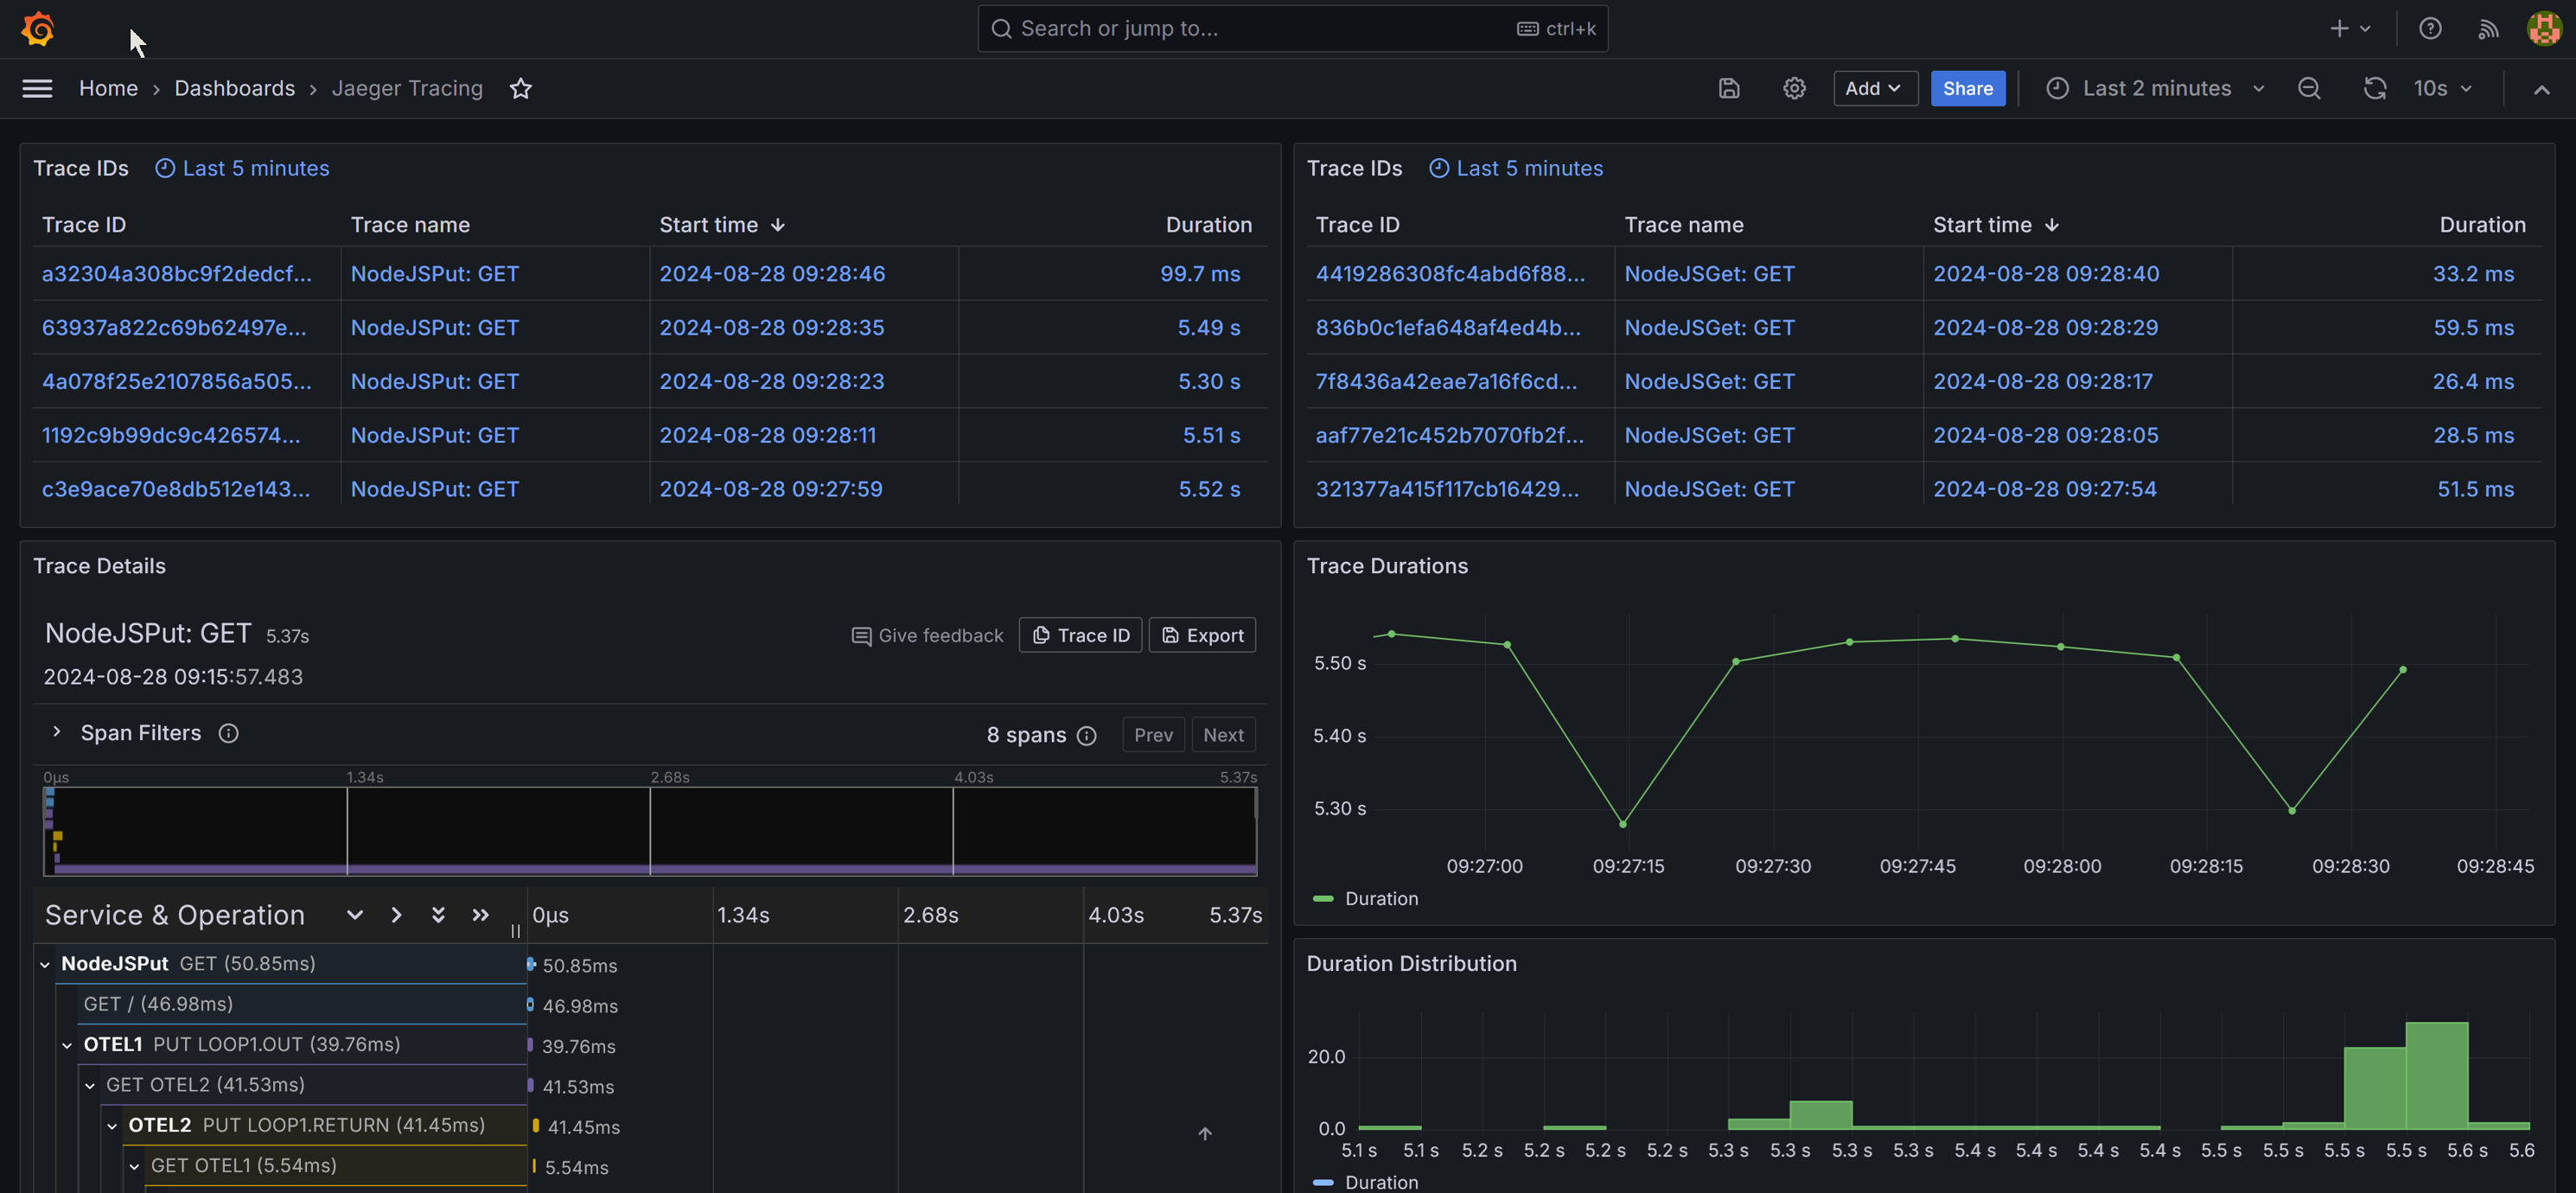
Although we can see the details of one trace in the bottom left panel of this dashboard, the Grafana interface to Jaeger turned out to be a bit limited. And perhaps a Grafana bug, but it was not possible to show two trace graphs within the same panel.
So I went direct to the Jaeger UI to do some more investigation:
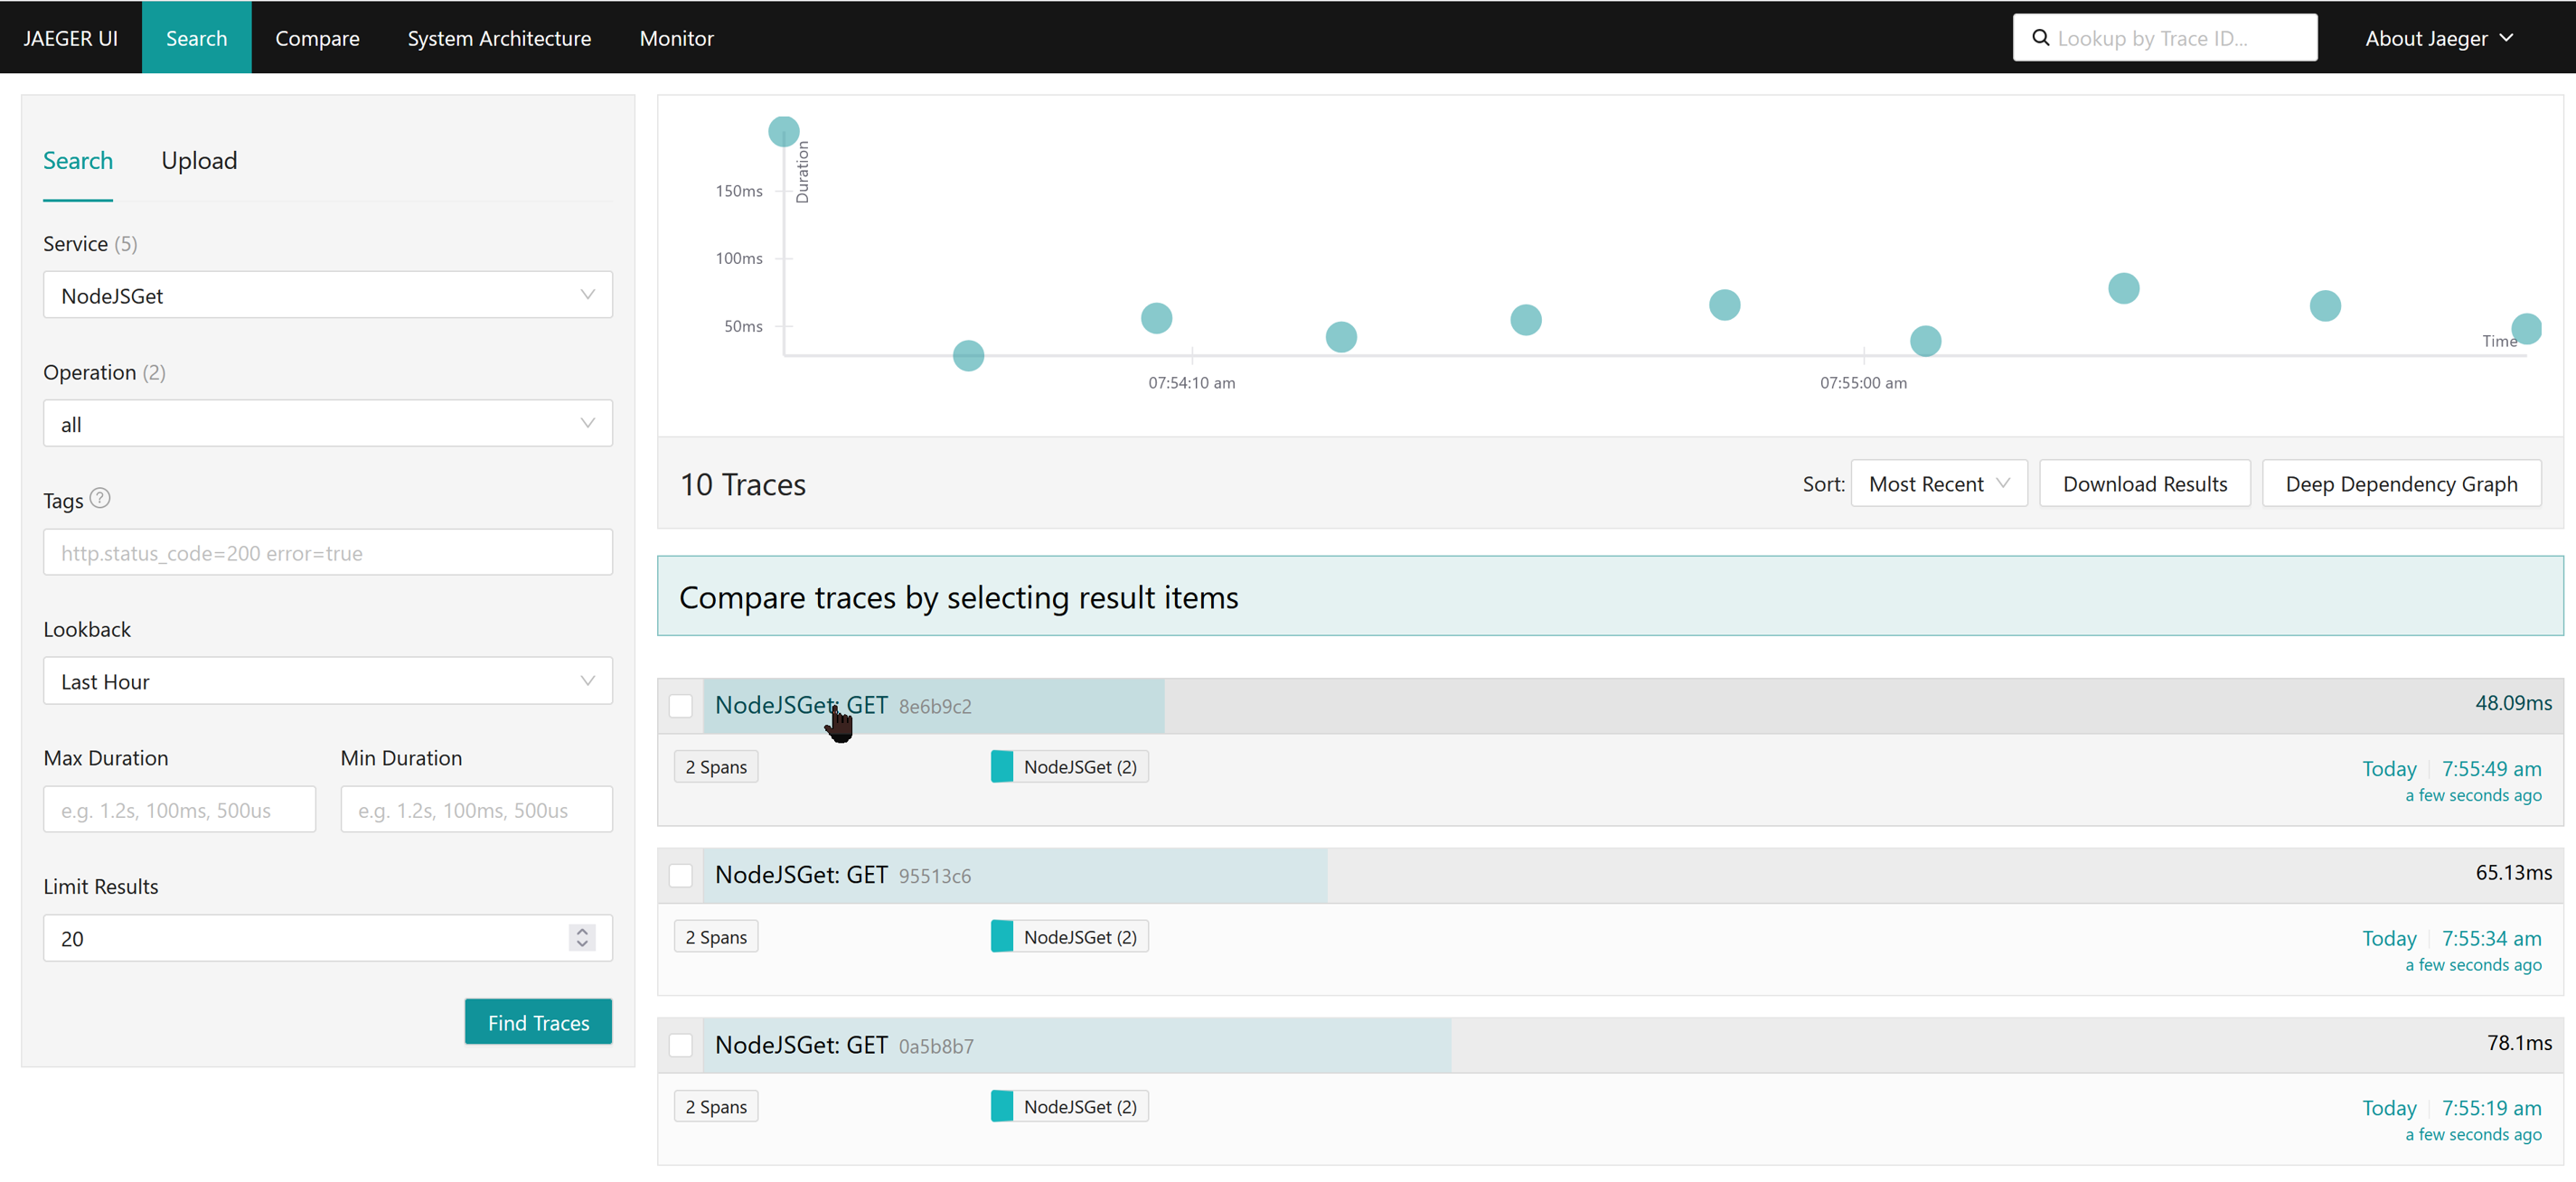
These traces show occurrences of the “Trace 2” part of the scenario. Selecting one, we see the pieces of that application flow. Which only consists of the HTTP GET aspect:
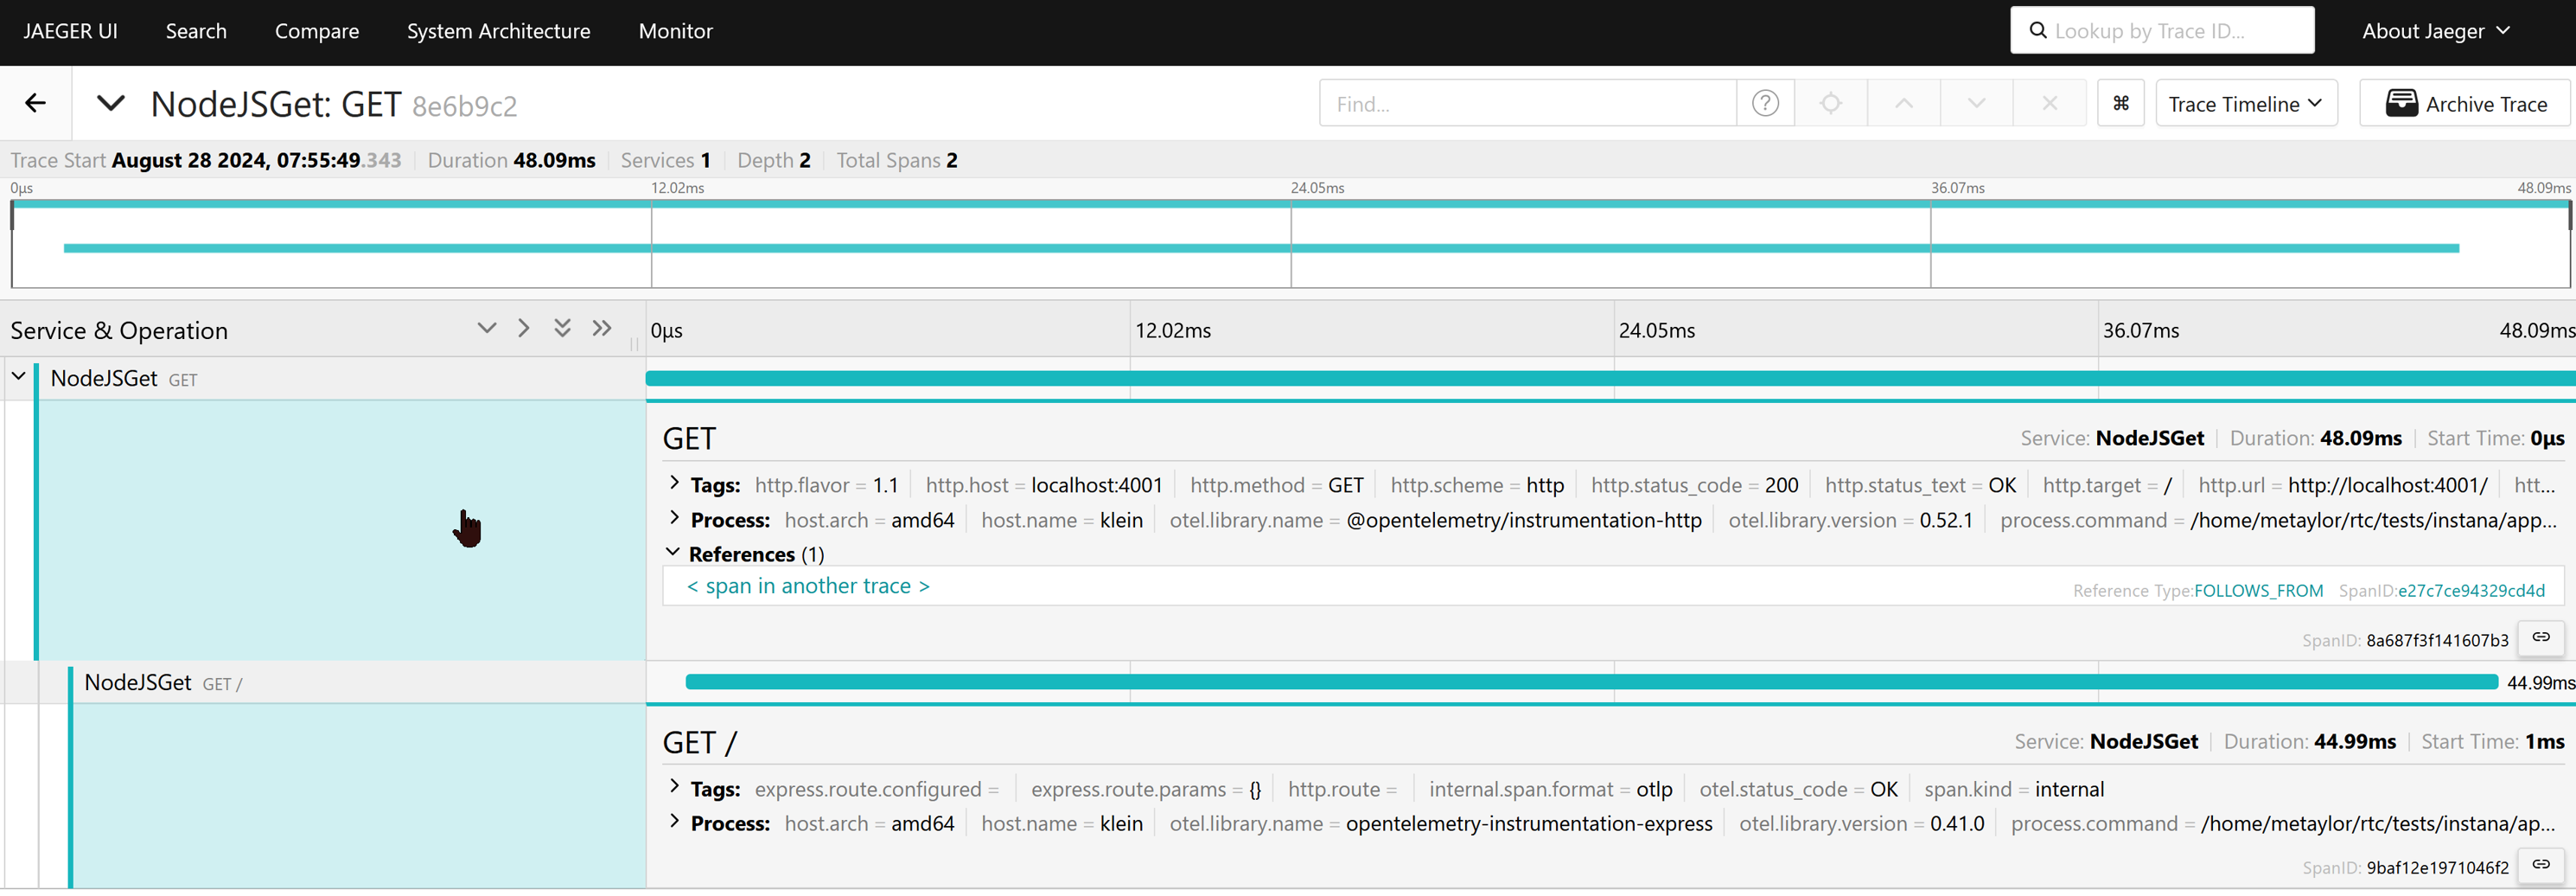
The interesting part happens when we select the “span in another trace” link:
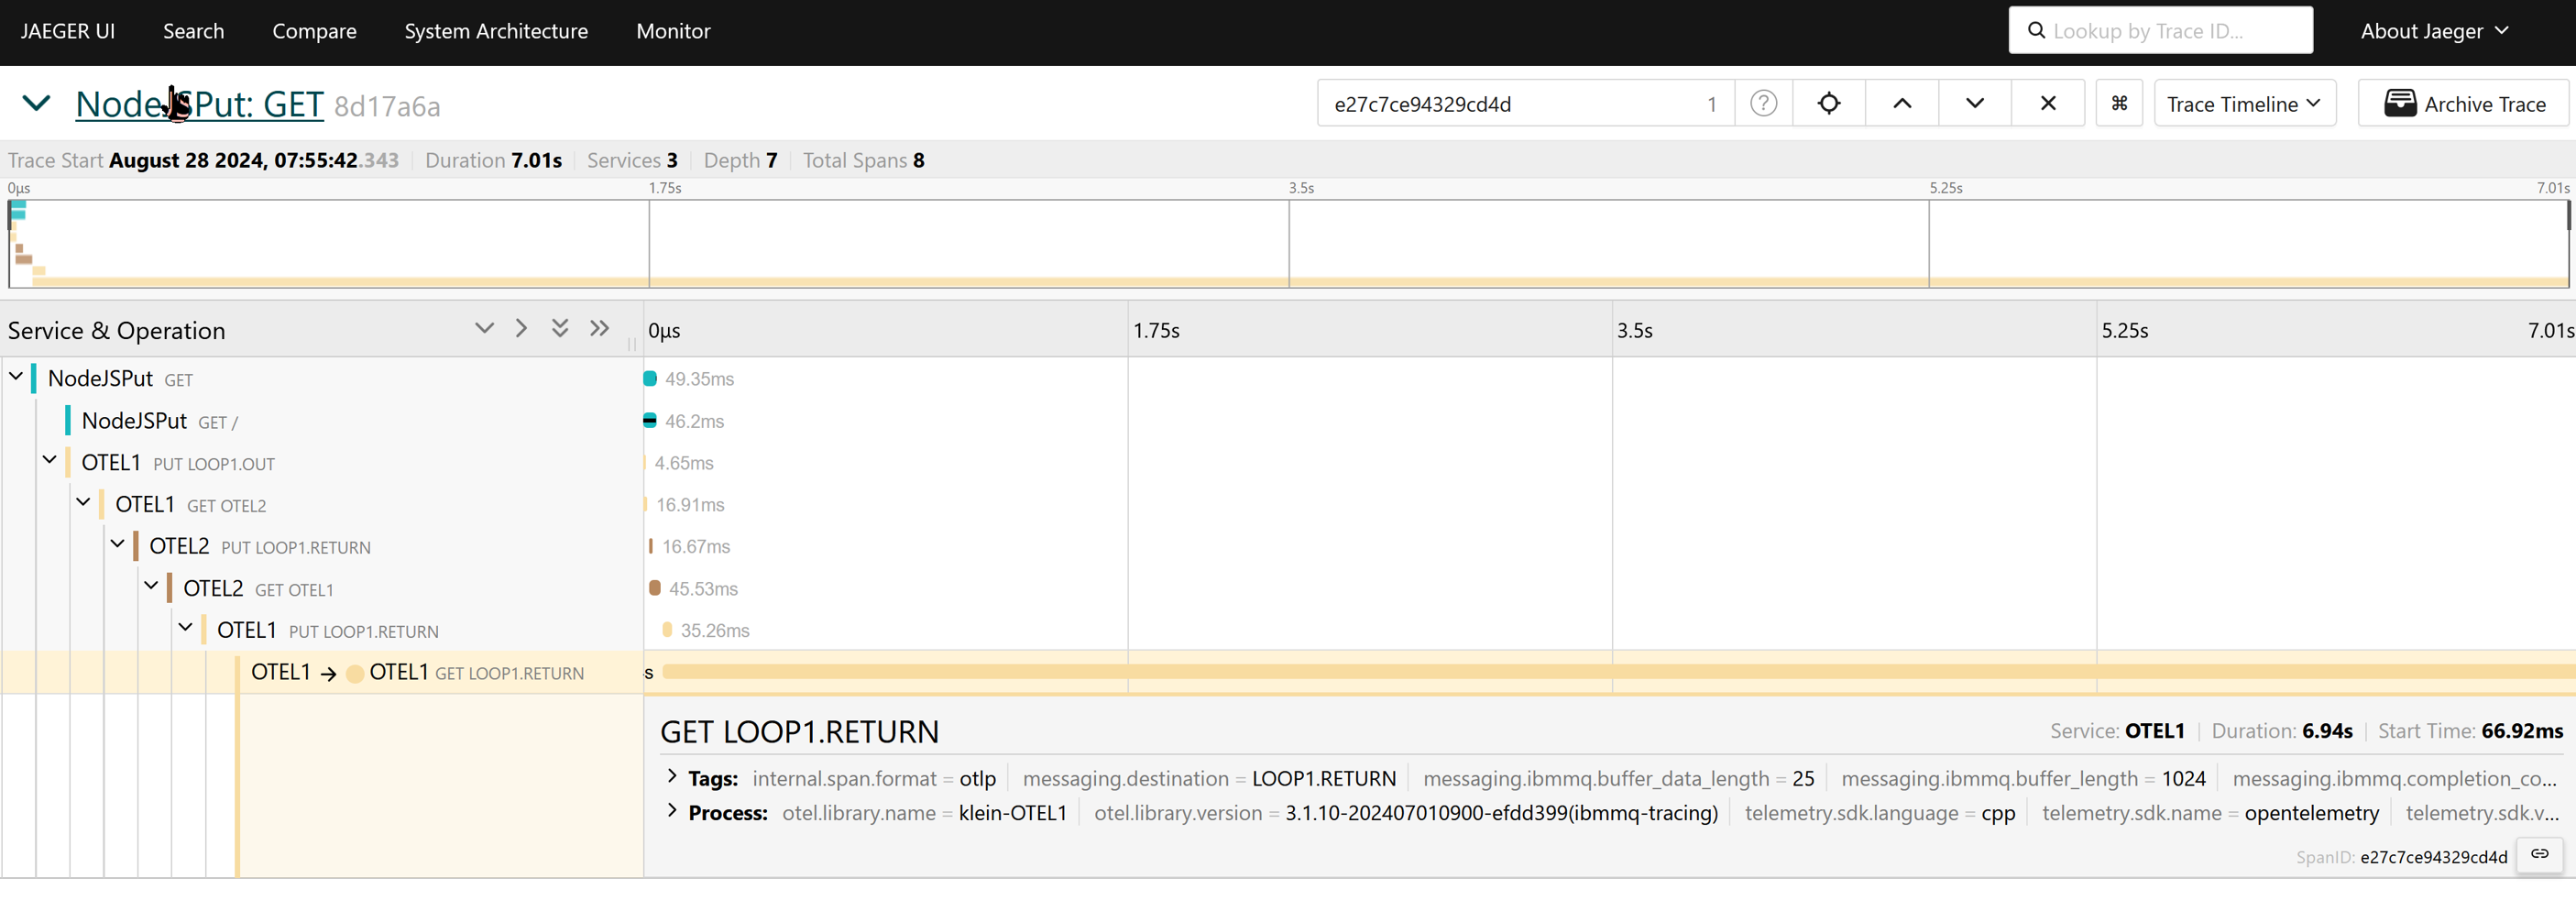
Here we can see all the steps of the top piece of the scenario. The application starts some work when it receives an HTTP GET request, an MQ message starts its path through a network, and the application work for that trace ends on consumption of the message from a queue.
Conclusion
OpenTelemetry makes a lot of promises about application observability. Those promises can only be met by instrumenting multiple components that applications might use, and often by instrumenting the application stack explicitly. Because of the vendor-neutral way in which OTel applies, and the number of vendors involved, it looks to have a better chance of succeeding than some previous efforts. But it’s not all there yet. For a number of environments, it’s still not simple to get that instrumentation in place.
My view is that there are a number of aspects that OTel have not reallv covered, including dealing with existing, older applications and their environments. For example, they’ve apparently ruled out C language SDKs and are trying to impose use of C++ libraries for C applications, with all the impracticality that brings.
But I hope that the work I’ve done for these MQ bindings demonstrate how much can be done, without imposing too much work on application code. The images here show the kind of data that can be extracted, and analysed to tell you a lot more about the application behaviour and performance.
Please let me know if these new MQ features are useful.
This post was last updated on February 23rd, 2025 at 09:36 am

Hi Mark, great info in the blog. Can you elaborate a bit more on the JMS/Java solution? I’m wondering if I’m on the right track with my solution. I’m using OTel for tracing in a producer and consumer Java application. I’m auto-instrumenting with the OTel Java agent. The agent appears to support auto context propagation for JMS when a messaging receive telemetry property is enabled (otel.instrumentation.messaging.experimental.receive-telemetry.enabled=true). However, I’m still not seeing the producer and consumer logic being joined under a single trace ID.
Link to JMS support in Java agent: https://github.com/open-telemetry/opentelemetry-java-instrumentation/tree/main/instrumentation/jms
The JMS tracing is not identical to the other pattern I’ve described, but it’s fairly close. I ran a very simple case with the MQ JmsProducer/JmsConsumer samples with the OTel Java agent and saw a single trace combining both the puts and gets. This is an extract from my test script showing the properties I needed – I didn’t use the “experimental” flag:
And the output in Jaeger included the JMS (from the Java agent) and MQ operations (from the Instana instrumenter) in a single flow. The screenshot should be attached.
OK thanks Mark. One other question, is the MQ tracing exit required to enable the linking of producer and consumer spans into a single trace like you have shown in Jaegar above?
No, but then you wouldn’t see any of the intermediate MQ channel steps. It would just go straight from the
jputtojgetspans in the above picture.Hi Mark,
We have this problem when implementing OTEL Java agent.
We have 2 flows of using JMS with Message Queue (IBM MQ).
The first one is:
A single thread receives a request, then sends this message to the queue, then waits for the reply message in the reply queue.
This way the agent can propagate the context and track all the step in the transaction.
The second way is (Asynchronous):
One thread receives a request, then sends this request to the queue, at this point its job is done.
One thread from another pool is waiting at the reply queue, receives the reply message and responses.
This way I have two transactions (for 2 threads), so I cannot see a full workflow.
Any suggestion? Thanks a lot.
This sounds like there ought to be a linkage between different spans, in the same way as I have described here for Go and Node.
But as I wrote in the “Part 3: JMS” article, the owners of the java-agent component seem to have chosen (incorrectly in my view) not to create these links. (In fact, it looked like they did have the links at one point and then decided to remove them). It’s probably something you need to raise there.
In the meantime, the only other solution I can think of would be for your application code to pull out any available span information and emit its own span that explicitly gives the link. Which does go against the auto-instrumentation approach but at least has a chance of working.