Previous articles in this series have shown OpenTelemetry (OTel) Context propagation for Node.js, Go and C/C++ MQ applications. You should read the first article for an introduction and explanation of the scenarios and problems that need solutions.
This (final?) entry discusses JMS applications.
Background
I was encouraged to write this 3rd post, to pull it out from what started as comments underneath the first of this OTel series. I said then that we needed no special work to support JMS applications with OTel tracing, but I did still end up writing an application to demonstrate that statement was true. And it did show some differences in trace contents that are worth highlighting.
Automatic Tracing
The OTel SDK developers provide automatic tracing capability for several languages and several standard (or commonly-used) packages. One such combination is the Java language and the JMS API.
No additional work is required in your application code to take advantage of this. The only change is how you start the application.
Example
As with the other languages discussed in this series, I started with the dice-rolling application described here.
And then I replaced the work with MQ operations. In this case, it was to make JMS calls to send or receive messages through an MQ network. Although the application would work with the generic JMS classes (eg Session), I deliberately chose to make the program variables belong to the MQ-specific equivalent subclasses (eg MQSession). That was to confirm that the instrumentation module supports MQ’s implementation of the JMS API.
Application Startup
There was no code change for instrumenting this application. Just configuration and startup options:
agent=./opentelemetry-javaagent.jar
putProps="-Dotel.resource.attributes=service.name=javaPut"

agentProps=""
agentProps="$agentProps -Dotel.javaagent.logging=none"
agentProps="$agentProps -Dotel.exporter.otlp.protocol=grpc"
agentProps="$agentProps -Dotel.exporter.otlp.endpoint=http://localhost:4319"
agentProps="$agentProps -Dotel.metrics.exporter=none"
agentProps="$agentProps -Dotel.logs.exporter=none"
agentProps="$agentProps -Dotel.trace.exporter=otlp"
agentProps="$agentProps -Dotel.trace.exporter.otlp.protocol=grpc"

java -Xshare:off -javaagent:$agent \
       $putProps $agentProps \
       -jar ./build/libs/putget.jar LOOP1.OUT OTEL1
The opentelemetry-javaagent.jar module came from the OTel repositories. From the source code tree, you can see which packages it knows about. One of those integration points is JMS. Using the javaagentoption to the java command causes this module to be loaded before running any of the real application code. It then inserts calls around any of the APIs it recognises, to emit the OTel traces and spans.
The configuration options tell the OTel instrumentation module what kind of information it should emit, and how. I’ve requested just the tracing data, to use the OTLP/gRPC protocol.
Results

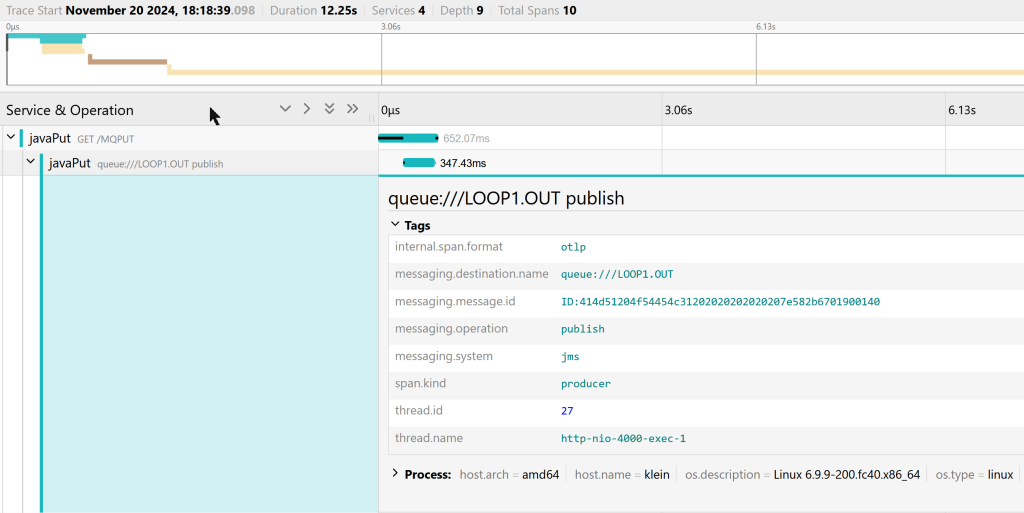
The interesting span in this trace is the one labelled as javaPut queue://LOOP1.OUT publish. The JMS instrumentation has recognised the call to the JMS producer send() method and reported it. Expanding the tags associated with that span shows more details:

The name of the queue appears, as does the MessageID. And the subsequent spans demonstrate that it sets suitable message properties, so that the MQ tracing exit can propagate the context.
Differences
This looks similar to the traces I showed in the previous articles. But there is one clear difference: the trace from the Getting application does not have an explicit link to the Putter’s. The two traces are disjoint. You could try to correlate them by using the process.pid values and timestamps in the two traces (as the Putter’s trace still concludes when the Getter consumes the message). But that may not be completely reliable.
Another less-visible difference is that we can see how long it takes for the API call to flow across the MQ Client channel – one span is emitted as the send() happens (although it’s labelled as “publish” – an indication of how the specification was originally created), and the next span appears as the message is put to the target queue. The other language bindings I discussed in the previous articles do not emit spans of their own so you don’t see the network stage.
There seems to have been debate, ambiguity, and evolution in both the overall OTel specifications for messaging, and specifically in the JMS implementation of the instrumentation. But hopefully all the implementations will eventually agree.
Conclusion
I hadn’t been planning on writing much about the JMS instrumentation, but it’s probably been worth it for completeness. And I hope this explains how the pieces fit together.
This post was last updated on November 21st, 2024 at 07:15 am
