This post shows how you can use Grafana to selectively view information about your MQ configuration. Which may sound a little odd. Grafana’s strength is primarily to show statistics and metrics in pretty graphs. So why would we want to use it to look at queue definitions? The answer is that you usually would not! There are many more appropriate tools for displaying and updating the queue manager configuration – even the MQ Explorer or MQ Console are better. But there may be times when a limited set of information may be desirable, so you can link from a graph to a different view, within the same tool.
But another important aspect that I hope this shows is the power of a common data format. The techniques I’ll show here could be used to combine a variety of different tools, and perhaps this will give you some ideas.
Background
Over the last few years I’ve written several articles about showing MQ statistics in Grafana. I was recently giving a demonstration of looking at z/OS data (you can see a video of that demonstration here) and was asked if it was possible to drill down from one of the graphs to see queues which had a particular configuration. The short answer to that question was “No” but it got me thinking about the feasibility.
And I saw a completely independent question about using the dmpmqcfg program to obtain the MQ configuration in a format other than MQSC, to make it easier to work with programmatically.
From those two prompts, I came up with some simple scripts to extract MQ object definitions and then use them to build tables in Grafana.
The pieces of the idea
Grafana includes a number of plugins which know how to query a variety of databases in order to extract information that can be formatted as graphs or tables. Most of the plugins are for time-series databases such as Prometheus and InfluxDB, specialising in storing metrics. But one of the plugins knows how to issue arbitrary SQL queries to a MySQL database.
A MySQL database can work with data stored in JSON format.
And MQ V9.1.3 included enhancements to the REST Admininistration API that outputs responses from MQSC commands as JSON.
So putting these pieces together in the correct order, we can
- Issue commands like “DISPLAY QLOCAL” via the REST Admin interface
- Store the output in a MySQL database
- Write Grafana dashboard queries that use SQL to extract data that will be displayed as a table
Tools used
Apart from normal shell script stuff, this demonstration uses the following tools:
- MQ V9.1.3 – version needed for the JSON-formatted output
- Grafana – of course
- MySQL – the database
- mysqlsh – a separately installed utility progam to simplify data import
- curl – to drive the MQ web server
- jq – to filter JSON data
Extracting the queue manager configuration
I wrote a script that looks a little like an MQSC command line, that builds the JSON version of the command and executes it via curl. This makes it simple to issue several similar commands and get the output in a state ready for import to MySQL.
The script, which I called mqscJ, is invoked like this:
mqscJ QM1 DISPLAY QLOCAL "*"
The output from this script looks like
{
  "commandResponse": [
    {
      "completionCode": 0,
      "parameters": {
        "acctq": "QMGR",
        "altdate": "2019-08-21",
        "alttime": "15.32.28",
        "boqname": "",
        "bothresh": 0,
        "clchname": "",
        "clusnl": "",
        "cluster": "",
        "clwlprty": 0,
        "clwlrank": 0,
        "clwluseq": "QMGR",
        "crdate": "2019-08-21",
        "crtime": "15.32.28",
        ...
For my environment, I didn’t need to make the webserver URL a variable – it is hardcoded in the script.
A second script, dmpmqsql, calls this first script for all of the queue managers and object types we are interested in. It uses the jq command to do a little bit of reformatting of the output. One thing that is missing from the output of the REST API is the name of the queue manager. That’s perfectly understandable, as you know to which queue manager you’ve issued the command. But when the data is being stored for multiple queue managers, the name needs to be added back in. And jq makes that easy. I also strip return codes, and rename the parameters block to something much shorter as we may be typing it many times in the SQL queries. After jq has done its job, the output looks like
{
  "queueManager": "QM2",
  "a": {
    "acctq": "QMGR",
    "altdate": "2019-01-26",
    "alttime": "10.41.27",
    "boqname": "",
    "bothresh": 0,
    "clchname": "",
    "clusnl": "",
    "cluster": "",
    "clwlprty": 0,
    "clwlrank": 0,
    "clwluseq": "QMGR",
    "crdate": "2019-01-26",
    ...
Importing JSON into MySQL
The mysqlsh utility makes it very simple to import JSON files into a MySQL database. If a table of the given name does not already exist, it creates one containing just two columns. The entire body of a JSON object goes into one of those columns called doc. More complex imports are possible, to allow for more flexible table definitions, but this works well enough for our purposes.
For this process, a single database (MQCFG) will contain multiple tables, one for each of the MQ object types. In this case, I decided to separate the different subtypes of queue so we get individual tables for QLOCAL, QMODEL etc as well as one for the QMGR attributes and one for all the CHL definitions.
After the import, we can refer to elements of the JSON object in SQL queries based on the real SQL column (“doc”) and the JSON field (eg “name”). The syntax used by MySQL to point at these looks like doc->>"$.name". The double arrow in this reference tells MySQL to remove quote characters surrounding strings.
Creating a Grafana dashboard
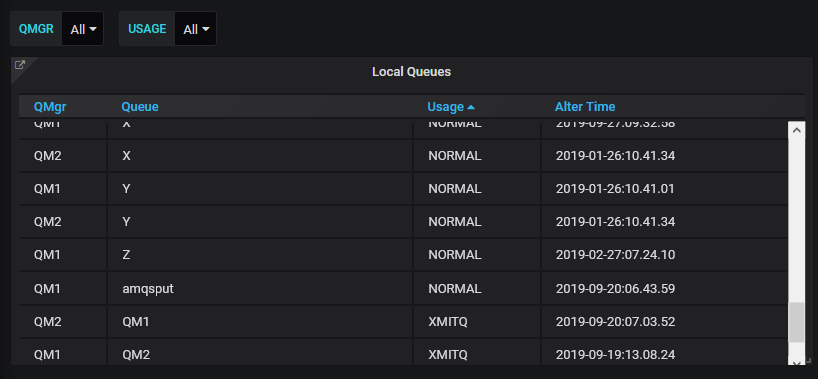
I chose to make a very simple dashboard, consisting of a single panel showing a table of local queues along with their alteration time. The table can be filtered by queue manager name, and by whether the queue is a transmission queue or not. Both the contents of the table, and the filtering, are managed by SQL queries.

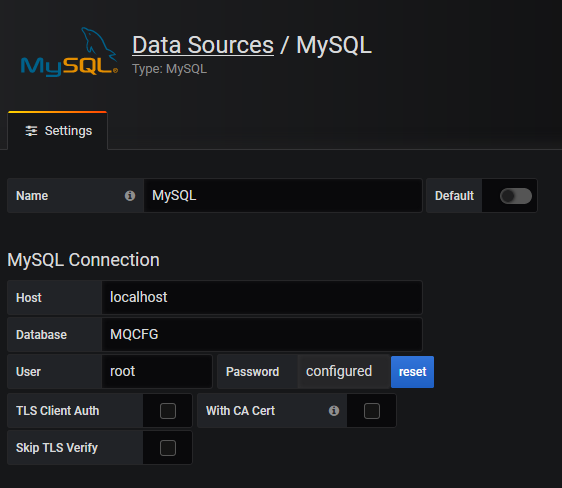
The first step is to add a MySQL datasource to Grafana. Once you have tested that the connection works, you can start using the queries.

Variables
Variables are the way of choosing the subsets of data that are going to be shown. They will appear at the top of the dashboard with dropdowns to allow selection.
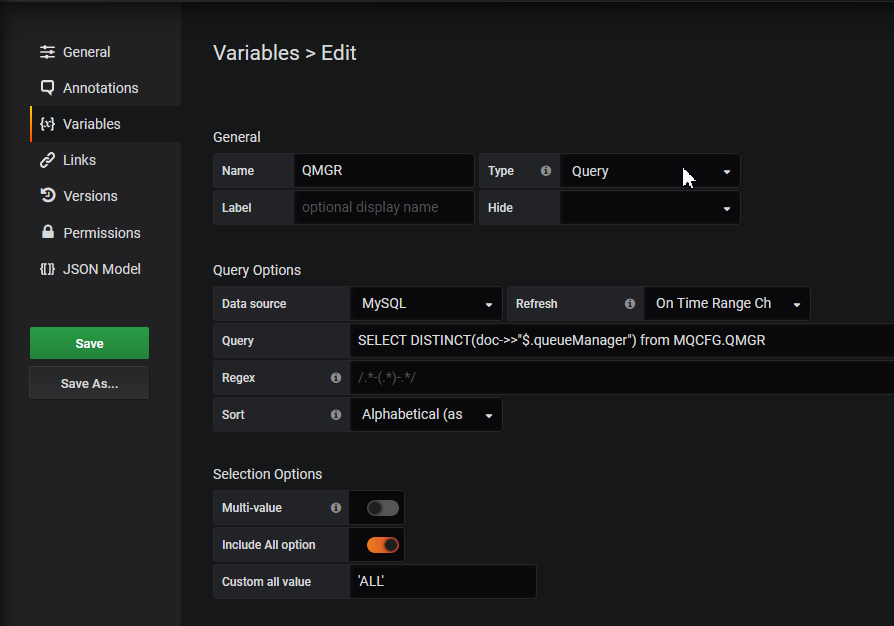
Once you have created a new empty dashboard, then you use the Settings menus to add variables to it.

Here, you can see two variables defined, both of which have a similar pattern. The queue manager variable gets its possible values from a SELECT on one of the tables. There is a further ALL value possible. In the Grafana definition of the variable, the Custom all value is set to 'ALL'. The quotes around this string are important as this piece of text is later inserted into a SQL query. As no real queue manager can have quotes in its name, this should not cause any confusion. Similarly, the Usage variable gets defined – while I could have coded the only possible two values directly for this variable, I decided to follow the queue manager pattern and dynamically get the values via a query. Variables in Grafana have the ‘$’ prefix.

Tables
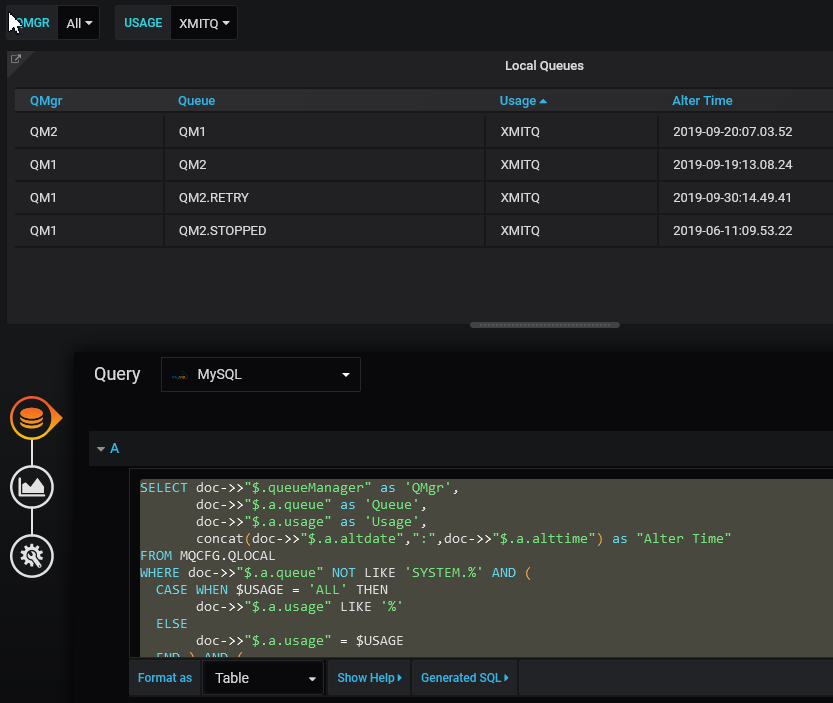
Now that we have the variables, we can use them as filters in the query that extracts the data. Add a panel to the dashboard, and say that it is going to be displayed as a table, using the MySQL datasource. The columns from the SQL query become the columns in the displayed table, including the column headers.
The SQL uses the variables defined previously to construct the query.

The full SQL in this query is copied here:
SELECT doc->>"$.queueManager" as 'QMgr',
       doc->>"$.a.queue" as 'Queue',
       doc->>"$.a.usage" as 'Usage',
       concat(doc->>"$.a.altdate",":",doc->>"$.a.alttime") as "Alter Time"
FROM MQCFG.QLOCAL
WHERE doc->>"$.a.queue" NOT LIKE 'SYSTEM.%' AND (
  CASE WHEN $USAGE = 'ALL' THEN
       doc->>"$.a.usage" LIKE '%'
  ELSE
       doc->>"$.a.usage" = $USAGE
  END ) AND (
  CASE WHEN $QMGR = 'ALL' THEN
       doc->>"$.queueManager" LIKE '%'
  ELSE
       doc->>"$.queueManager" = $QMGR
  END )
ORDER by Queue;
Getting the scripts
The mqscJ and dmpmqsql scripts, along with an example Grafana dashboard are available from a GitHub gist here. It didn’t seem worth creating a full repository for these small pieces of code.
Possible Enhancements
The scripts are written only to the level needed to demonstrate the principles. They do not do much error checking, especially of the
responses from the REST API. They also have hardcoded queue manager names and the URL for a single web server.
The JSON processing in MySQL is not going to be as efficient as regular SQL columns and indexes. If the extracted configuration was expected to be used more heavily, I’d probably look at adding some of the JSON fields as standard typed columns.
The MySQL configuration is also hardcoded to access a local database instance. The scripts have the userid and password fixed in them too.
Constructing this dashboard was a very manual process. I might want to programmatically build the Grafana dashboard to more easily show a few more variables and tables.
Summary
Building general purpose data queries for Grafana to look at the MQ configuration is not a natural fit. I’d expect people using these tools to only define a few standard tables to fit common situations they might hit. The goal is to not have to jump to a separate tool for these specific aspects; as soon as you need something more flexible, then go to a more appropriate environment. But for example, you might frequently want to see objects known to a particular cluster. On z/OS you might build a table showing which queues are stored in particular pagesets. Extracting the configuration and populating a database becomes very convenient.
But beyond this, I hope it’s also clear how being able to work with JSON makes it practical to link all kinds of tools together.
This post was last updated on November 25th, 2019 at 02:18 pm