In 2016 I wrote about how MQ’s resource statistics can work with a number of time-series databases, including Prometheus. This permits monitoring using the same tools that many customers use for monitoring other products. It allows easy creation of dashboards using tools such as Grafana.
Since that original version, we’ve made a number of enhancements to the packages that underpin that monitoring capability. For example, more database options were added; a JSON formatter appeared. One notable change was when we split the monitoring agent programs into a separate GitHub repository, making it easier to work with just the pieces you needed.
And now, I’ve released some changes that allow Prometheus and generic JSON processors to see some key channel status information. In particular, a Grafana dashboard can easily highlight channels that are not running.
What does it show
The fastest way to understand it is to see a simple dashboard:
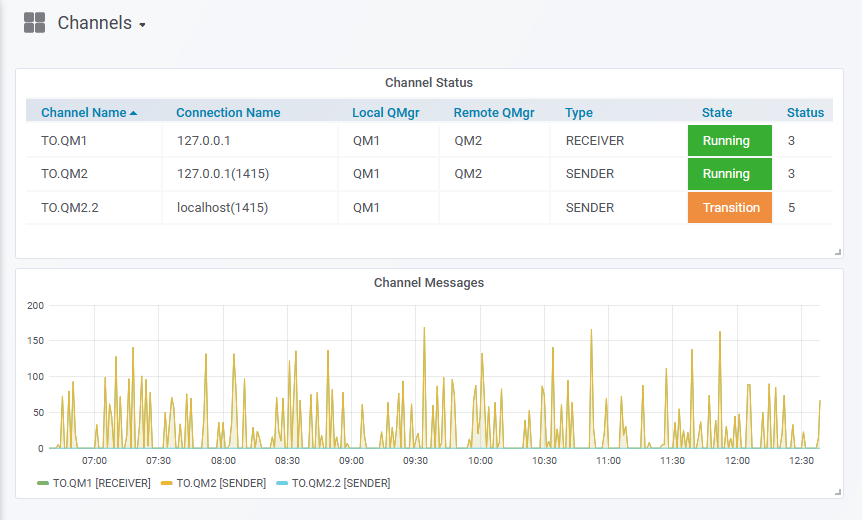
In this picture, you can see current channels along with key information such as where they connect, what the channel type is, and how many messages are flowing across channels.
The JSON version
Along with the Prometheus collector, I also updated the JSON formatter in the same GitHub repository. Output from that can go to any tool that understands JSON. Here is an example of the JSON-formatted metrics:
{
  "collectionTime": {
    "timeStamp": "2018-11-08T12:14:31Z",
    "epoch": 1541679271
  },
  "points": [
    {
      "tags": {
        "qmgr": "QM1",
        "queue": "APP.4"
      },
      "metrics": {
        "mqgetBrowseNonPersistentBytes": 0,
        "mqgetBrowseNonPersistentMessage": 0
        ...
    }
    {
      "tags": {
        "channel": "TO.QM2",
        "connname": "127.0.0.1(1415)",
        "jobname": "00000F2D00000001",
        "qmgr": "QM1",
        "rqmname": "QM2",
        "type": "SENDER"
      },
      "metrics": {
        "instanceType": 1011,
        "messages": 0,
        "status": 3,
        "statusSquash": 2,
        "type": 1
      }
  },
  ...
}
Metrics
For channels, the main reported statistic is the number of messages transferred in the last interval. The current status also appears.
Squashed Status
The picture shows two versions of the channel status. On the right, you see the real channel status, or at least its numeric value. For example, “3” corresponds to the MQ constant MQCHS_RUNNING. It is possible to have Grafana convert these numbers into text, by adding a specific text mapping operation in the panel’s configuration. I chose not to do that here partly for simplicity in testing, but also because of the alternative version of channel status.
This second version shows up in the State column and is a metric I’ve invented called status_squash (or statusSquash in the JSON version). There are about 15 values corresponding to the different states for a channel. The “squashed” metric takes those 15 and reduces them to only three possible values to indicate a channel that is definitely running, definitely not running, or somewhere between (for example in Binding state). Having just three values matches with how Grafana configures traffic light colours for a metric. It also makes it easier to put the text mapping against the values.
Tags
The design for time-series databases is built around storing numbers, not text strings. It may not be practical – and certainly is not possible with Prometheus – for a metric or datapoint to have a value such as “RUNNING”. Tags or Labels are the mechanism to associate some text with the metric. These tags are for long-lived values, not for things that might change frequently such as the depth of a queue. For the channel information, tags include the channel name along with several other pieces of identification intended to distinguish between multiple instances of the same channel name. You might, for example, have multiple receiver or svrconn channels running simultaneously with the same name. But the combination of the channel name along with its connname and the other labels make it unique. Grafana can display these tags in the legends describing panels.
How does it work
Unlike the published resource statistics, we find the channel status by polling the queue manager and issuing the equivalent of the DISPLAY CHSTATUS command. You can see the commands and the attributes extracted from the response in the channel.go source file. That command accepts generic names, so you do not have to restart the collector if you create a new channel whose name matches one already provided in the program’s configuration.
How to configure it
Both the Prometheus and JSON collector programs accept a -ibmmq.monitoredChannels parameter. This is a comma-separated list of generic patterns, with trailing “*” characters. For example
-ibmmq.monitoredChannels="TO.*,FROM.*"
Start the collector with that option, and it then reports the status at each interval. You can modify the interval for the channel information polling independently of the Prometheus collection interval. Use the -pollInterval option for that. You may want to use it when the queue statistics are being gathered frequently, and you don’t want to add the extra channel status polling at every iteration.
-pollInterval=1m
The package includes a sample Grafana dashboard that shows channel status. If you import that dashboard to your Grafana environment, you can look at details of how the panels are constructed to create your own queries.
Summary
After the initial release of the Prometheus interface, several people asked for additional information, particularly around MQ channels. I hope this goes some way to meeting those requests.
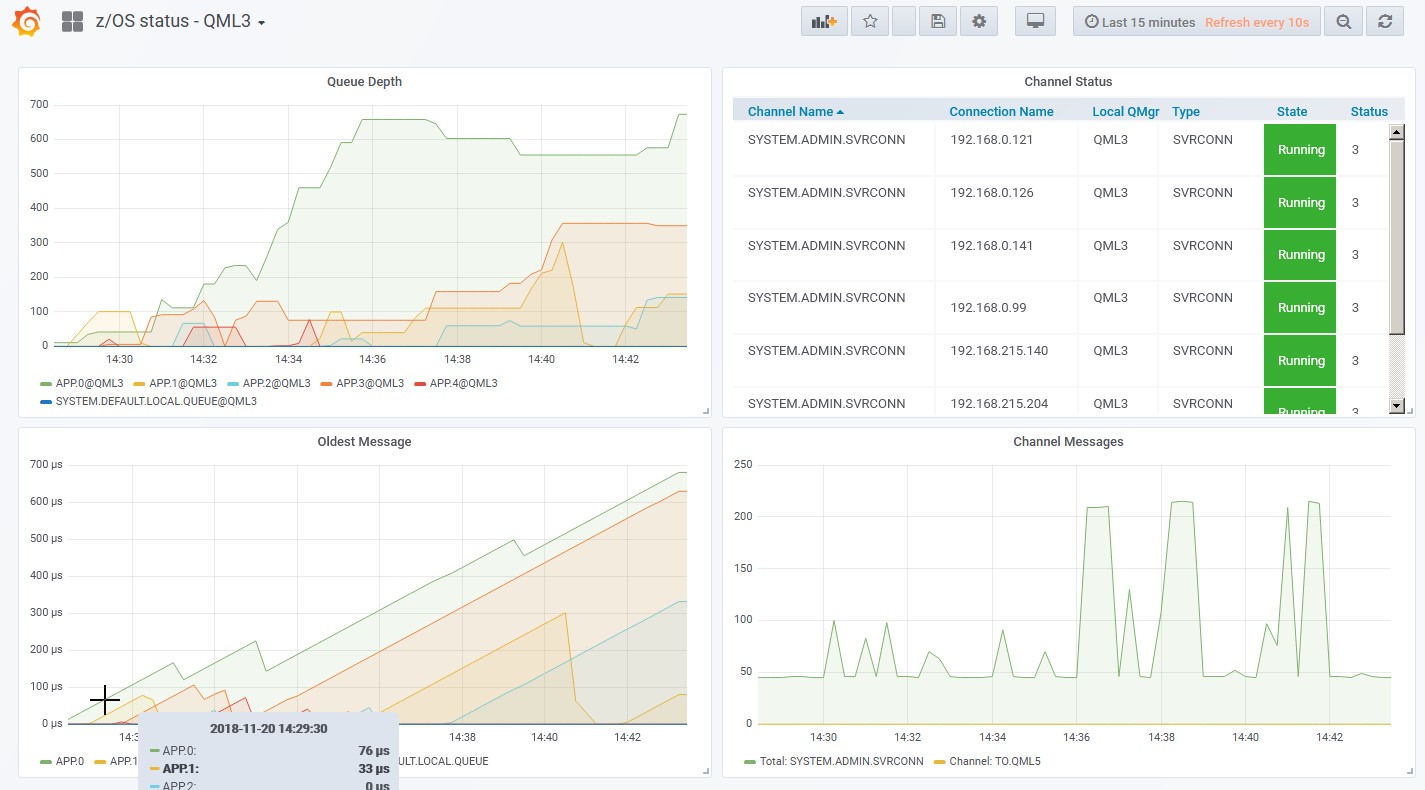
November 20 2018 Update – Additional status and z/OS support
Last week I was with a group of z/OS customers and mentioned this new channel status support. While talking, I realised that even though MQ on z/OS does not implement the published resource statistics that are the basis of this MQ monitor, the channel status would work there. And adding a little bit of queue information was also feasible based on the DISPLAY QSTATUS command. The audience was rather enthusastic about the idea, one customer in particular saying that he had been just been given instruction to put some level of Prometheus monitoring around his organisation’s queue managers. So I added that feature and it is now available from the GitHub repository.
This post was last updated on November 25th, 2019 at 09:53 am