In a previous blog entry I wrote about using the Go language with MQ. One of the reasons for creating that Go package was to enable the creation of a program that sends MQ statistics to Prometheus and hence to be easily visualised in Grafana. This blog shows how it all fits together.
Introduction
MQ V9 metrics
MQ V9 (and the MQ appliance) makes many statistics available through a pub/sub interface. One huge benefit of the pub/sub model is that this data can be collected without interfering with any other monitoring programs. An early prototype of the MQ exporter for Prometheus used the RESET QSTATS command just to prove the concept, but that is not a good command to use in general when you have any other tools that may also use it. Publish/subscribe gives easy isolation for monitors.
There is much more information about these metrics in the MQ KnowledgeCenter and other blog posts.
What is Prometheus
Prometheus is an open-source monitoring and alerting solution, whose particular strength is the collection of time series data, with the ability to easily query that data. For example, the number of MQPUTs to a queue may be of interest, and this kind of database makes it easy to see how many operations occurred in an interval, or calculate averages. Prometheus works by pulling information from exporters such as this MQ program at configured intervals over an HTTP connection. It provides libraries in several languages to enable products to export data to it, but the most commonly used is probably the Go library – hence the need for an MQ Go package.
What is Grafana
Grafana provides a way to create dashboards and visualise data held in time series databases. It has Prometheus as a built-in data source, making this pair of products a natural fit together.
Getting started with the monitor
Building the monitor
The github repository contains the monitoring program, the ibmmq package that links to the core MQ application interface and other prerequisite components.
The command
git clone https://github.com/ibm-messaging/mq-metric-samples
should pull down the client code and its dependencies. The README file in the root of that package shows how to compile the code, either locally or within a Docker container.
Configuring MQ
It is convenient to run the monitor program as a queue manager service, automatically started and stopped along with the queue manager.
The source code directory contains an MQSC script to define such a service. In fact, the service definition points at a simple script (also provided) which sets up any necessary environment and builds the command line parameters for the real monitor program. As the last line of the script calls “exec”, the process id of the script is inherited by the monitor program, and the queue manager can then check on the status, and can drive a suitable STOP SERVICE operation during queue manager shutdown.
Edit the MQSC script and the shell script to point at appropriate directories where the programs exist, and where you want to put stdout/stderr. Ensure that the mqm id running the queue manager has permission to access the programs and output files.
The monitor listens for calls from Prometheus on a TCP port. The default port, reserved for this use in the Prometheus list, is 9157. If you want to use a different number, then use the -ibmmq.httpListenPort command parameter.
The monitor always collects all of the available queue manager-wide metrics. It can also be configured to collect statistics for specific sets of queues. The sets of queues can be given either directly on the command line with the
-ibmmq.monitoredQueues flag, or put into a separate file which is also named on the command line, with the -ibmmq.monitoredQueuesFile flag. An example is included in the startup shell script. For example,
mq_prometheus -ibmmq.QueueManager="QM1" -ibmmq.monitoredQueues="APPA.*,APPB.*"
starts the monitor to collect the statistics for all queues whose names begin APPA and APPB.
Note on queue patterns
For now, the queue patterns are expanded only at startup of the monitor program. If you want to change the patterns, or new queues are defined that match an existing pattern, the monitor must be restarted with a STOP SERVICE and START SERVICE pair of commands.
Configuring Prometheus
The Prometheus server has to know how to contact the MQ monitor. The simplest way is just to add a reference to the monitor in the server’s configuration file. For example, add this block to /etc/prometheus/prometheus.yml with any changes needed for your hostnames and ports.
  # Adding a reference to an MQ monitor. All we have to do is
  # name the host and port on which the monitor is listening.
  # Port 9157 is the reserved default port for the MQ monitor.
  - job_name: 'ibmmq'
    scrape_interval: 15s

    static_configs:
    - targets: ['hostname.example.com:9157']
The Prometheus documentation has information on more complex configuration options, including the ability to pull information on which hosts should be monitored from a variety of discovery tools.
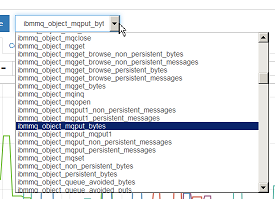
Once the Prometheus server has picked up the MQ configuration, the metrics can be seen under the jobname of ibmmq. The values are labelled with the queue and queue manager names, to assist with selection. This picture shows some of the available information in the selection drop-down:
You can select an item from this panel and see its recent values with the queue and queue manager labels. For example,
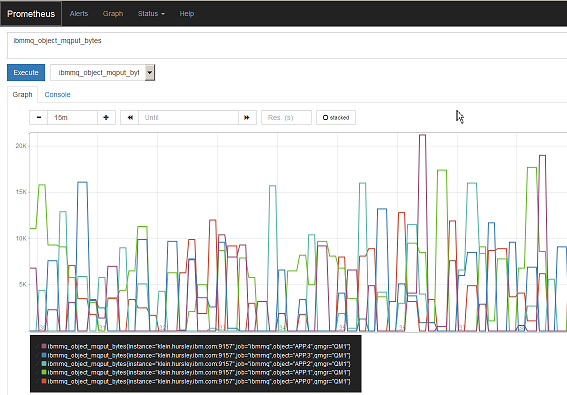
However, it is more flexible to work with the graphing and dashboard views from Grafana.
Configuring Grafana
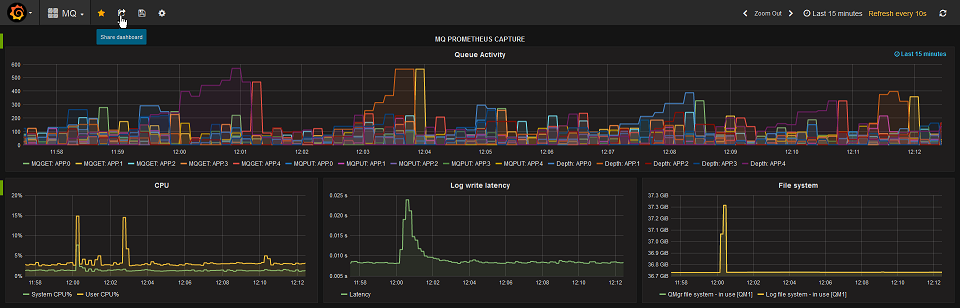
Once the Prometheus system is working, grafana can use it as a datasource – again, only a hostname and portnumber is required when adding this type of datasource. And from there, all of the MQ metrics can be accessed and added to dashboards. As an example, this dashboard is looking at several items including the same queues as above, and CPU and logging information:
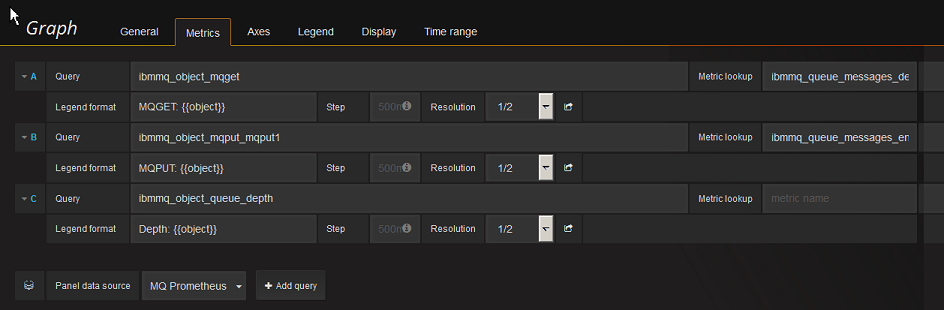
This picture shows how the top panel was configured, to select several metrics and show the object name in the legend:
Deployment in Docker containers
All of these components can be configured to run inside Docker containers to simplify deployment. To get started, almost everything in the existing Prometheus and Grafana containers can be left to default, except for the need to add the MQ configuration to prometheus.yml. For example, I have this simple Dockerfile
FROM prom/prometheus
ADD  prometheus.yml /etc/prometheus/prometheus.yml
where I’ve added the ibmmq block shown above to the default yml file.
And then this script gets both the Prometheus and Grafana components running, using local directories under /var/docker to hold their persistent data:
  docker build -t my-prometheus .
  ARGS="--config.file=/etc/prometheus/prometheus.yml"

  docker run -p 9090:9090 -v /var/docker/prom:/prometheus \
    --detach my-prometheus $ARGS

  docker run -p 3000:3000 -v /var/docker/grafana:/var/lib/grafana\
    --detach grafana/grafana
The MQ exporter program and its configuration can also of course be baked into a Docker image. The MQ docker image on Github has information on the configuration of MQ. The service definition, the shell script and the actual monitoring program can all be copied into a new image.
Conclusion
This article has shown how the statistics generated by MQ can easily be used in some of the monitoring packages that are commonly used with various cloud and container-based systems. The MQ data can be integrated with other metrics to give a complete view of your environment.
I would welcome feedback on this tool. Please leave any feedback here, or in the GitHub issue tracker, whether bugs, enhancements, or thoughts on the value of the monitoring.
This post was last updated on November 27th, 2021 at 03:00 pm
This is a great article, thank you for sharing.
How do I create an alert Panel on Grafana that just shows alerts such as “high queue depths” and “messages not consumed in last 30 minutes”? Not expecting anything fancy here, a simple list would do, is that possible?
Grafana alerts are based around the queries you issue. You can apply alert rules to the panels, and also have a separate panel listing all the current alerts. See https://grafana.com/docs/grafana/latest/alerting/unified-alerting/ for details, For example:
Thank you for the last answer. I was wondering what is the equivalent query to get the enqueue and dequeue rates for the entire queue manager and a set of queues/a queue?