In this final(?) blog entry of a series, I’m going to show how you can monitor MQ queue managers using Amazon’s CloudWatch service.
Previous blog entries
The earlier blog entries in this sequence include
and there is also a video on the IBM Messaging channel showing the resource monitors in action.
Keeping the demo simple
For the purposes of this demonstration, I stayed away from running any actual code on AWS. That avoided having to deploy programs into images, or configure much security. The queue manager runs on my local Linux workstation, as does the grafana service. The data is pushed to, and retrieved from, CloudWatch running in AWS but that’s all. In reality, someone using CloudWatch is likely to want to include the monitoring collection program in an EC2 image to run alongside the queue manager in that instance. And that in turn will require a security role to be configured with that instance, in a similar way to how Arthur has described using CloudWatch to collect MQ error logs.
Security configuration
For my simple setup, I had to have accessible credentials so that I could write to CloudWatch. Since the MQ service runs under the mqm account, I put a copy of a credentials file containing the AWS_ACCESS_KEY and AWS_SECRET_KEY into ~mqm/.aws/credentials. That file may also contain the user’s default AWS region (eg “us-west-2”) for connection; if not provided there, the region can be given as a parameter on the mq_aws command line. That same file was also put under the home directory of the grafana userid so it can use CloudWatch as a data source.
The MQ program
All of the MQ programs for monitoring are in the same github repository. Cloning that repository gives copies of all of the MQ source code, configuration scripts, and example Grafana dashboards.
You can then build the collection program with
go build -o mq_aws cmd/mq_aws/*.go
Just as for the other monitoring programs, configure the queue manager through the MQSC and shell scripts in that directory, so that the main program is started as an MQ Service.
Looking at CloudWatch data
Once the monitoring program is running correctly (you can look for errors in /var/mqm/errors/aws.out if you keep the same MQSC script), the metrics are sent to CloudWatch.
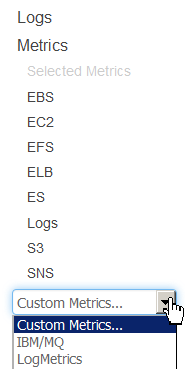
When you log into AWS and go to the CloudWatch Management Console you can see them in the Custom Metrics section, under the IBM/MQ namespace:
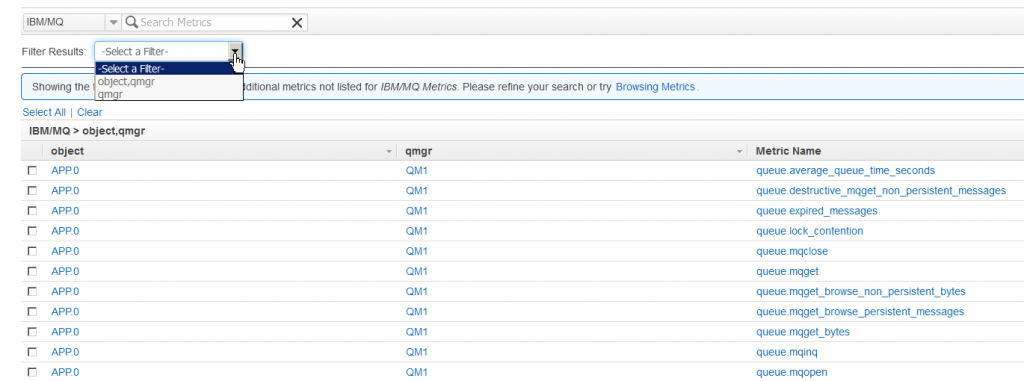
From there, metrics can be selected. You can see two filters, one for the queue-related metrics (which of course also includes the queue manager name as a field) and one for the queue-manager-wide metrics:
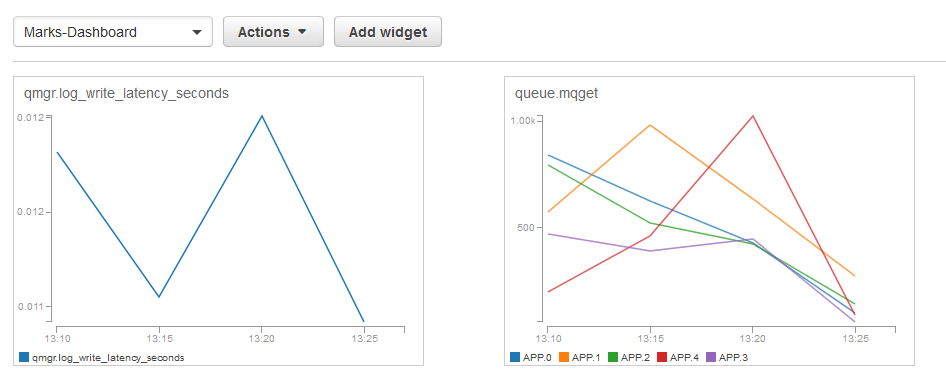
Selecting some of these metrics allows creation of a dashboard in CloudWatch.
Using Grafana
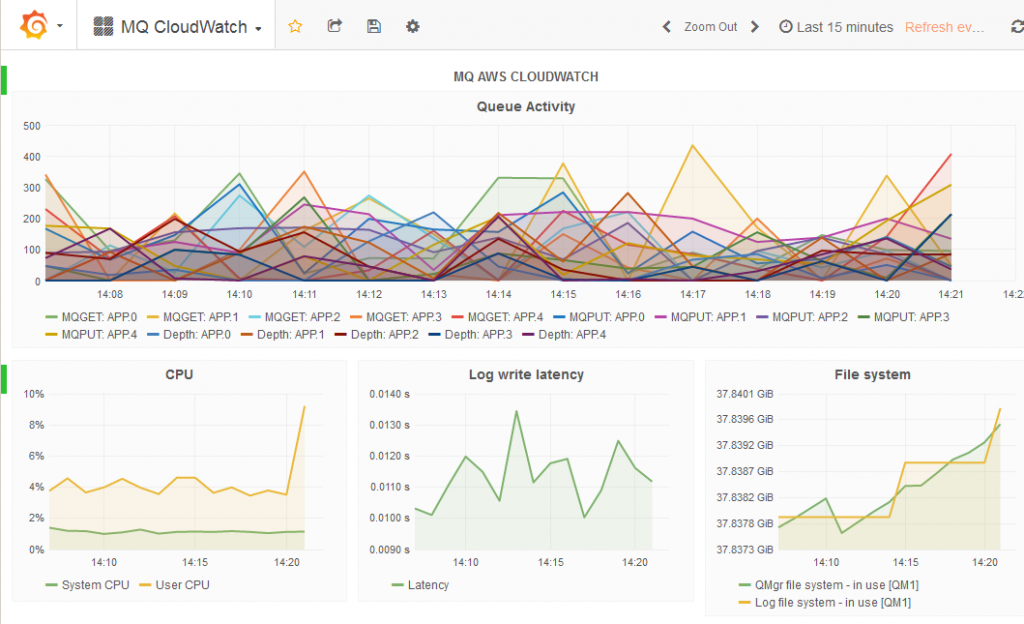
The CloudWatch dashboard is not very sophisticated graphically, but it does at least allow graphs to be created and shown. Better as a visualisation interface is Grafana. And for that, I created a dashboard similar to that used for all the other databases in this series of articles. The biggest difference is that there does not seem to be a way to directly query using wildcards for the queue or queue manager names (“dimensions” in CloudWatch terms); using Grafana templates might be a way to deal with that. The queries used in my sample dashboard explicitly name the queues to be monitored. Also, refresh times are
set to be much less frequent because of the rates used in CloudWatch, and the pricing model that charges for queries and updates.
Summary
This series of articles has shown how MQ V9 can feed data into a variety of monitoring solutions, including those commonly-used for cloud deployments of queue managers.
I would welcome feedback on these tools. Please leave any feedback here, or in the GitHub issue tracker, whether bugs, enhancements, or thoughts on the value of the monitoring.
This post was last updated on November 23rd, 2019 at 12:28 am