
As I promised in a recent article, I am coming back to the OpenTelemetry topic. This time, it’s going to be about another pillar of the observability requirements – integrating MQ’s metrics with OpenTelemetry.
I’ve written many times about the monitoring packages maintained here. The tools in that repository can send metrics to a range of destinations and databases such as Prometheus. The latest update to that repository extends the collection components to send the information to an OpenTelemetry (OTel) environment.
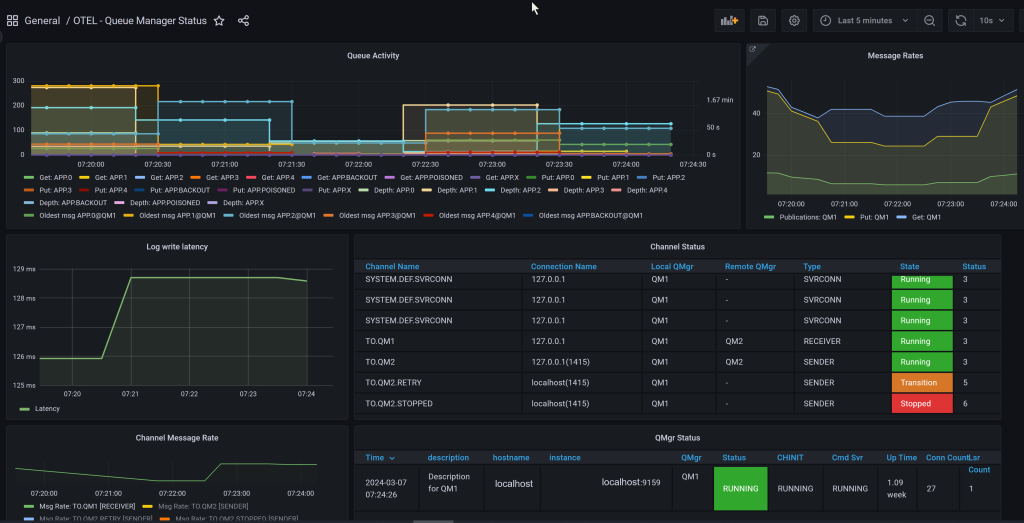
The visible metrics are the same as for the other collectors – things like queue depth and number of API calls made in an interval.
Output Destinations
The OTel client packages permit configuration of a range of communications protocols to get the data to a variety of backend stores. For this particular implementation, I’ve chosen to only have configuration for two mechanisms – sending the metrics to stdout (which appear in JSON format), or sending them in OTLP format over the gRPC protocol.
The JSON-style output:
{"Resource":[{"Key":"service.name","Value":{"Type":"STRING","Value":"ibmmq"}},{"Key":"service.version","Value":{"Type":"STRING","Value":"0.0.1"}}],"ScopeMetrics":
[{"Scope":{"Name":"ibmmq","Version":"","SchemaURL":""},"Metrics":[{"Name":"ibmmq.qmgr.exporter_collection_time","Description":"How long last collection took","Uni
t":"1","Data":{"DataPoints":[{"Attributes":[{"Key":"platform","Value":{"Type":"STRING","Value":"UNIX"}},{"Key":"qmgr","Value":{"Type":"STRING","Value":"QM1"}}],"S
tartTime":"0001-01-01T00:00:00Z","Time":"2024-03-01T08:24:10.027338544Z","Value":0}]}}]}]}
Because the metrics might be going to any number of backends, OTLP/gRPC is the preferred “common” mechanism that the OTel Collector proxy can handle. It can then deal with the varying onward protocols.
Counters vs Gauges
The OTel definitions have a clear distinction between “Counters” and “Gauges”. Counters are metrics that continue to increase; for example the number of messages transferred across a channel. Gauges are metrics that indicate the current state of something, but do not make any sense as cumulative values. For example, the number of application connections right now.
The queue manager reports some of the “counter”-type metrics as a truly cumulative value across the lifetime of the object, but other metrics as a delta value since the last collection. Generally, this distinction comes from the metric appearing either from a DISPLAY xxSTATUS command or from the published resource metrics, as used by the amqsrua sample program. Since we have to choose one or the other approach, we send all counters as deltas – where necessary, this tool calculates the delta from the previous scrape.
The distinction between Counters and Gauges is particularly relevant when building dashboards. The operations available may differ depending on the kind of metric. See here for good introduction to handling counters.
As always, the exact format of the metric names will vary by database. Whether elements are separated by dots or underscores or a mixture … But the visualisation tools like Grafana or a database-specific equivalent ought to provide a way to explore the available names.
A simple configuration
I used the OTel Collector as a proxy to handle the data, rather than going direct to a particular database. Because I already had a Prometheus database running locally, I used that as the final destination.
The relevant parts of the OTel Collector configuration:
receivers:
  otlp:
    protocols:
      grpc:
        endpoint: 0.0.0.0:4317

service:
  pipelines:
    metrics:
      receivers: [otlp]
      processors: [batch]
      exporters: [prometheus]

exporters:
  prometheus:
    endpoint: ':9159'
    send_timestamps: true
    metric_expiration: 10m
    resource_to_telemetry_conversion:
      enabled: false
    add_metric_suffixes: false
This gets the OTel Collector listening on port 4317 for GRPC traffic, and listening on port 9159 for Prometheus callbacks. So I had to add a reference to 9159 in the Prometheus engine configuration too.
I also added a exporters.prometheus.namespacevalue in the configuration, simply to distinguish metrics being sent from the OTel environment from those sent direct to Prometheus by one of my other collectors. That’s unlikely to be something you would choose to do.
The MQ process then has this section in its OTel-specific configuration block:
otel:
  interval: 10s
  maxErrors: 10
  logLevel: INFO
  endpoint: localhost:4317
  insecure: true
The address of the OTel collector is in the endpointattribute. If that line is missing or empty, then the stdout destination is used instead.
The insecureis there to simplify my TLS configuration. In a production environment, you would obviously want to set up certificate stores etc. Although I’ve not exposed those certificate attributes in this YAML file, you can set them via environment variables recognised directly by the OTel client libraries. I’ve put references to those in the cmd/mq_otel/README.md file in the repository.
Building the MQ component
The MQ OTel component is built in the same way as all the other collectors in the repository. First:
$ git clone git@github.com:ibm-messaging/mq-metric-samples
From there, the easiest way is probably to use one of the included Docker build mechanisms:
$ cd mq-metric-samples
$ docker build --build-arg EXPORTER=mq_otel -f Dockerfile -t mqotel:0.1 .
To set up a configuration file, combine the config.common.yaml file with cmd/mq_otel/config.collector.yaml and edit it for your environment. Then run the built container, mounting the configuration:
$ docker run -it -v mq_otel.yaml:/opt/config/mq_otel.yaml mqotel:0.1
Once you’re happy that the configuration is good, you can remove the -it option to run as a detached container.
Summary
This is an initial release of an Open Telemetry metrics integration, and it reports itself as a 0.0.1version. And so I’m looking for any feedback on how useful it might be, or any additional features that might be appropriate.
This post was last updated on March 12th, 2024 at 07:27 am
Hi Mark,
In the blog you mention that “The MQ process then has this section in its OTel-specific configuration block:” which configuration elements and which file are you referring to here ?
Regards,
Sukesh
The MQ metrics collection program in the repository described and linked to in the article (in particular the 2nd paragraph). Its YAML configuration file has a per-collector-type block as the repo shows.