There will, no doubt, be full discussions elsewhere of the new MQ Native HA Cross-region Replication feature. But one aspect of it seemed particularly relevant to other articles on this site: monitoring the CRR metrics.
The MQ 9.4.2 release also includes another tool, mqperfck, that introduces some additional metrics. And I’ll talk about how that potentially affects other monitoring tools.
CRR Metrics
This older article shows the original Native HA statistics that the collectors in the mq-metric-samples repository can report.
The latest release of that package can also deal with the CRR metrics. In fact, if you are using these monitoring solutions, and you start to use MQ 9.4.2, then a very strong recommendation (a definite requirement for Prometheus) is to upgrade to this new version v5.6.2.
If you do not upgrade, you will likely see warnings or complete failures because the developers of the CRR feature “reused” existing metric names. So there are now two different metrics, both with the same basic name of backlog_bytes. To distinguish between these, I had to modify the collector code. You will now see names like ibmmq_nha_backlog_bytes (for the local HA replication) and ibmmq_nha_recovery_backlog_bytes (for the recovery group).
The metrics.txt file in the repository shows the complete set of metrics that are available, including the new CRR values which are in the RECOVERY part of the NHAREPLICA class. The metrics published on system topics are also documented here.
Class: NHAREPLICA
  Type: RECOVERY
    Backlog average bytes
    Backlog bytes
    Compressed log bytes sent
    Log data average compression time
    Log bytes decompressed
    Log data average decompression time
    Average network round trip time
    Rebase count
    Recovery log sequence number
    Log bytes sent
  Type: REPLICATION
    Log write average acknowledgement latency
    Acknowledged log sequence number
    Log write average acknowledgement size
    Backlog average bytes
    Backlog bytes
    Catch-up log bytes sent
    Catch-up compressed log bytes sent
    Catch-up log data average compression time
    Catch-up log bytes decompressed
    Catch-up log data average decompression time
    Catch-up uncompressed log bytes sent
    MQ FDC file count
    Log file system - free space
    Log file system - bytes in use
    Average network round trip time
    Queue Manager file system - free space
    Queue Manager file system - bytes in use
    Synchronous log bytes sent
    Synchronous compressed log bytes sent
    Synchronous log data average compression time
    Synchronous log bytes decompressed
    Synchronous log data average decompression time
    Synchronous uncompressed log bytes sent
I’ve also updated the example dashboard Logging.jsonto demonstrate:
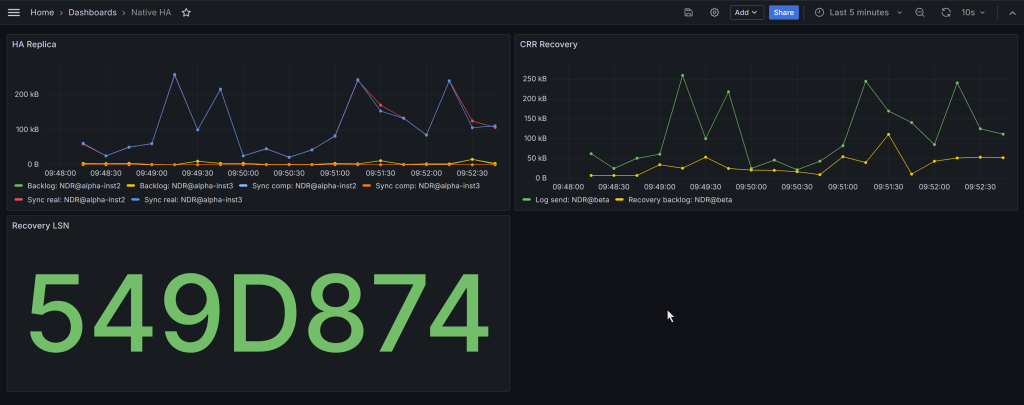
You can see the replication between the local HA instances (the 2 standby instances), and the data transfer to the recovery group.
This particular dashboard shows a Recovery LSN value. Ideally the panel would displayed it in the same fashion as the queue manager output. For example, as <000:111:222:333>. Unfortunately Grafana doesn’t have a way to reformat an integer in such a specific way. Maybe it will, one day. But at least you can see the 64-bit number moving.
MQPerfck metrics
Although separate from the CRR metrics, another tool arrives at the same time. The mqperfckcommand is primarily intended to capture some key metrics for analysis by L2/L3 support engineers. But it also brings in a similar problem to CRR for monitoring solutions: duplication of metric names. And so the mq-golang v5.6.2 release recognises and handles these names.
One block of published metrics added to the queue manager to support this tool is the EXTENDED type. These are very specialised, and not likely to be of use to most administrators. So, by default, the collectors do not report them. If you find you really need them, then you can set the queueSubscriptionSelectorfilter array in the collector configuration to include these EXTENDED values. Here, we can see the actual metrics that the amqsrua sample reports:
$ amqsrua -m QM1
CPU : Platform central processing units
DISK : Platform persistent data stores
STATMQI : API usage statistics
STATQ : API per-queue usage statistics
STATAPP : Per-application usage statistics
Enter Class selection
==> STATQ
OPENCLOSE : MQOPEN and MQCLOSE
INQSET : MQINQ and MQSET
PUT : MQPUT and MQPUT1
GET : MQGET
GENERAL : General queue metrics
EXTENDED : Extended queue metrics
Enter Type selection
==> EXTENDED
An object name is required for Class(STATQ) Type(EXTENDED)
Enter object name
==> Q1
Publication received PutDate:20250207 PutTime:10110583 Interval:11 days,0 hours,59 minutes,34.944 seconds
Q1   msg search count 0
Q1   msg not found count 0
Q1   msg examine count 0
Q1   intran get skipped count 0
Q1   intran put skipped count 0
Q1   selection mismatch count 0
Q1   correlid mismatch short count 0
Q1   correlid mismatch long count 0
Q1   msgid mismatch count 0
Q1   load msg dtl count 0
Conclusion
Two new MQ features introduce corresponding metrics. I’ve shown here how they can be collected and processed. I hope they’re useful.
Update History
- 2025-02-28: Added some links to other material
This post was last updated on March 1st, 2025 at 09:55 am
2 thoughts on “Native HA CRR metrics & mqperfck”