The mq-metric-samples collectors that send IBM MQ metrics and status data to a range of databases, ready to be viewed in Grafana, have just been enhanced to collect additional information. The Prometheus collector has also been extended so that it can continue providing limited status even when the queue manager is down.
The new metrics have all been suggested by users of the package either directly or via issues raised in the GitHub repository. Many previous articles on here show more about the collectors.
The InfluxDB collector is also refreshed for a new version of the database.
New status values
Some new values are available for inclusion in your monitoring dashboards. All of these values come from DISPLAY xxSTATUS commands, except for the cluster status which comes from the DISPLAY CLUSQMGR operation. The mqmetric package in the mq-golang repository is the common source of obtaining the data; the various collectors either get the benefit for free, or (when there’s a new “object type” such as a cluster) can be extended relatively easy to report it.
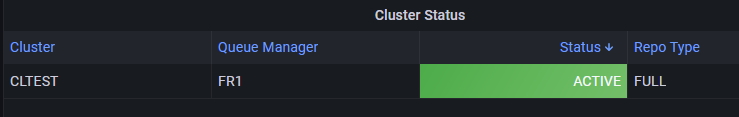
- cluster_suspend: When a queue manager is a member of a cluster, it shows whether the queue manager is suspended or not. You can also see whether the queue manager is a full or partial repository.
- qmgr_status: This shows whether the queue manager is currently running or not. Before this update, I didn’t bother collecting this value as the absence of any data was just as good an indicator of the queue manager being down. And that is still the situation for all collectors other than the one for Prometheus. But for that database, the continued collector execution and reporting of status, even when the queue manager is down, made it more useful.

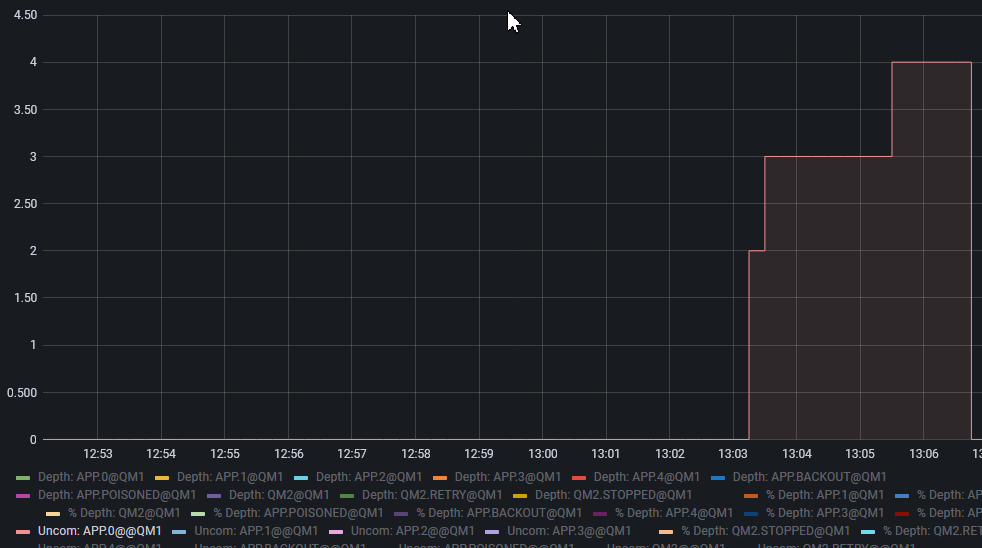
- queue_uncommitted_messages: This shows whether uncommitted operations (PUT or GET) are registered against the queue. On Distributed platforms, this shows an actual number; when monitoring a z/OS queue manager it only shows 1 or 0 to represent YES/NO.
Prometheus
The Prometheus collector has a different model than all of the other collectors: instead of a “push” approach from the exporter, the Prometheus engine “pulls” data from its configured collection agents. So the expectation is that the MQ collector should keep running. If the collector runs as an MQ service (configured to start and stop alongside the queue manager) then it will not be available when the queue manager is down. But if you are running the collector as a standalone process, then it’s better if the collector continues to run AND continues to try to reconnect to the queue manager while still reporting some degree of status back to the database.
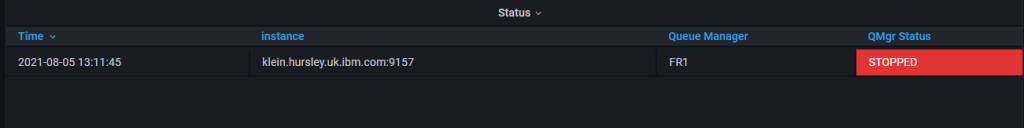
The latest version of the Prometheus collector has been extended to help with this. If you have the new keepRunning configuration attribute set to true (the default setting) then when the queue manager stops, the collector continues to run. While it can’t report most metrics, it does report that the queue manager is unavailable:
If you are running the collector as a service, then you should probably change the configuration so that it dies alongside the queue manager. Otherwise there might be conflicts when the queue manager restarts.
InfluxDB
The InfluxDB collector has been updated to use the V2 client and APIs for the database. This required quite a few changes to the configuration attributes. Primarily this means that an apiToken is now used instead of a userid and password combination. Like most of the credentials used by these collectors, the token can be supplied directly (on the command line or YAML configuration file) or by being the contents of a file that you name.
According to their documentation, the V2 client can still connect to a V1 database if you set the apiToken appropriately, as a combination of the userid and password.
The config.collector.yaml file in the source directory shows the new configuration attributes that are recognised.
Dashboards
The sample Prometheus and Influx dashboards for Grafana in the repository have been updated. For Influx, the new dashboard demonstrates some very basic use of Flux which is a new query language supported by both InfluxDB V2 and Grafana. There’s probably a lot more that can be done with that combination to better extract data and labels, but I wanted to just show a minimum of something working.
For Prometheus, the updated dashboards use the new status attributes and add them into either existing or new panels.
The Prometheus “Queue Manager Status” dashboard shows both the cluster status and the queue manager status. It uses Grafana’s colour coding to highlight the bad values.
Native HA
MQ 9.2.3 has a new feature called “Native HA” which does emit some metrics that can be subscribed to. For now, these collectors explicitly ignore these metrics as they require a bit more thought on how they will be reported. But I’d be interested to know if there are any requirements for them in future.
Summary
These collectors continue to be enhanced based on the feedback I get from users. So I hope they are still useful.
This post was last updated on November 27th, 2021 at 02:59 pm