New features with the MQ Go metric collectors

The mq-metric-samples collectors that send IBM MQ metrics and status data to a range of databases, ready to be viewed in Grafana, have just been enhanced to collect additional information. The Prometheus collector has also been extended so that it can continue providing limited status even when the queue manager is down.

The new metrics have all been suggested by users of the package either directly or via issues raised in the GitHub repository. Many previous articles on here show more about the collectors.

The InfluxDB collector is also refreshed for a new version of the database.

Continue reading “New features with the MQ Go metric collectors”

This post was last updated on November 27th, 2021 at 02:59 pm
Updates for MQ metric exporters

The MQ metric exporters are a set of Go programs that deliver queue manager statistics and status to databases such as Prometheus and Influx. They have recently been updated, giving more consistent function and a much easier configuration. This post will explore and explain these changes.

For an introduction to these exporters, see some of my earlier posts in this blog.

Continue reading “Updates for MQ metric exporters”

This post was last updated on November 27th, 2021 at 02:59 pm

IBM MQ – Further integration with open-source monitors

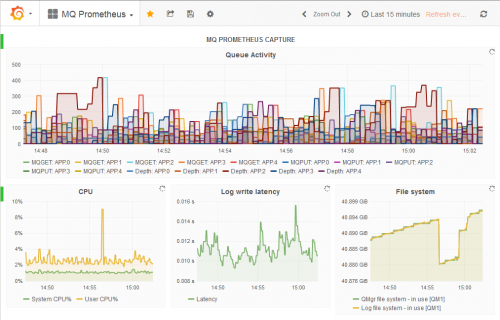
An earlier blog entry showed how to integrate MQ with the Prometheus database, capturing statistics that can then be shown in a Grafana dashboard. In this article, I’ll show how that initial work has been extended to work with more databases and collection tools.

The latest updates allow MQ to write directly to InfluxDB and OpenTSDB databases, and also to provide data to collectd.

Continue reading “IBM MQ – Further integration with open-source monitors”

This post was last updated on November 27th, 2021 at 03:00 pm