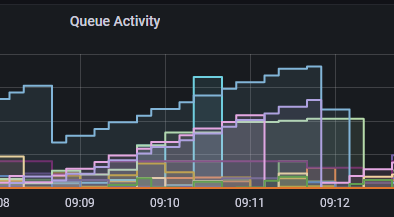
The sample monitoring packages here use a variety of techniques to collect metrics from the queue manager. The most recent release (v5.7.0) adds a further alternative approach.
These packages began by just using the published resource metrics. These gave information about the queue manager and queues. Over time, I’ve added operations that use the DISPLAY xxSTATUS commands for all object types, and some other queries where appropriate (for example DISPLAY USAGE on z/OS).
One drawback to using the published metrics for queues comes from the need to subscribe to topics for each separate monitored queue. The TUNING document in the repository gives some ways to reduce the impact of this – both in terms of the discovery of which queues should be monitored and the actual subscription handles. But I’ve now added a new configuration option that some people might prefer to explore.
The Distributed queue managers can emit STATISTICS events that provide similar metrics for queues and the queue manager as the published metrics. They are not identical; one is not even a proper subset of the other. But there is a large overlap. Although the queue manager can also generate events for channels, these are ignored here as the CHSTATUS information that we can already process is essentially equivalent.
Configuring the queue manager
The events are enabled by setting the STATMQI attribute for the queue manager to ON. To configure which queues are monitored, either set the queue manager’s STATQ option to ON and the queue’s STATQ option to QMGR, or set the queue’s STATQ option to ON.
Also set the queue manager’s STATINT value to something appropriate to your metrics collection interval. The default value of 1800 seconds (30 minutes) is probably far too high; something like 15 seconds is more like the interval that you want to see reflected in dashboards. The STATCHL setting is ignored; any generated channel statistics events are discarded.
The events are sent by default to the SYSTEM.ADMIN.STATISTICS.QUEUE although some administrators redefine the queue manager configuration using aliases and administered subscriptions so that the events can be consumed by multiple monitoring applications. Make sure that the maximum depth of this queue is sufficient for the number of events created; the queue manager writes to the error logs if this queue becomes full so that it cannot write new events.
Note that we are NOT processing the similarly-named, and similarly-configured Accounting events that report on individual application operation.
Configuring the collectors
Setting the global.useStatistics option for the collection programs to true turns on this mode of operation. The default value of this option is false. You can also set which queue to read, if it is not the default admin queue.
You will probably still want the global.usePublications option set to true, along with the useObjectStatus option. Between them, these give the fullest set of metrics.
Enabled collectors
Recognising and processing the statistics events is available only in the OTel, Prometheus and JSON collectors in this repository.
As the DEPRECATIONS file says, my plan is to remove the other collectors at some future point. Probably coinciding with the next LTS version of MQ. That’s because OTel makes it possible to get to so many different backends that database-specific collectors are becoming less interesting and less relevant.
The collected metrics
Once the useStatistics option is set, then this overrides some – but not all – of the topic-based metric collection.
In particular, we no longer collect the STATQ and STATMQI published metric classes. But we do still want to subscribe to other queue manager level metrics, such as the LOG information and reports coming from the NativeHA components. That’s why it is still useful to have the usePublications option turned on.
There is no need for the monitoredQueues setting. Using statistics events means that we can effectively derive the list of queues to report on based on their STATQ attribute.
The names for the event-based metrics are not necessarily the same as those used for equivalent topic-based metrics. There was enough difference between the sets of metrics, that I did not think it worthwhile attempting to maintain the same names. Any dashboards you create to report on these events would have always been likely to need rework anyway.
If you look at the full definition of the statistics event messages, you can see that the queue manager reports some metrics as arrays of values. For example, the number of messages put to a queue has two values. The array holds separate values for persistent and non-persistent messages. Reports for many of the MQI operations split by object type, unlike the published metrics which just give a total of, say, the MQOPEN verbs. While you could design dashboards that add up all of the individual MQOPENs, I’ve simplified things by creating a new metric, not directly part of the real event message, that gives the sum across these arrays.
Look at the metrics.txt file to see all of the metrics available through this mechanism. And the product samples amsqmon and amqsevt are able to format these events so you can see the contents more directly.
Prometheus
For the Prometheus collector, setting the useStatistics option will also force the overrideCType option to true. This correctly distinguishes between Counters and Gauges, something that is not the default behaviour today for the topic-based metrics. I’m planning on having that override option become the default in a future version anyway, but it would be a breaking change for existing dashboards. As the event-based option requires new dashboards anyway, I’ve decided to impose that change earlier here.
Summary
This alternative collection mechanism may simplify configurations. It may also (though not definitely) improve performance of metrics collections.
Let me know what you think.

It is rather confusing to call these event messages. If they were event messages, then the PCF Type would be MQCFT_EVENT like it is for event messages. Instead, statistics messages have a PCF Type of MQCFT_STATISTICS.