
Previous articles in this series have shown OpenTelemetry (OTel) Context propagation for MQ applications in different languages.
This article is rather different. It shows the results of experiments I made with adding OTel tracing to the IBM MQ Kafka Connectors.
Introduction
The MQ Kafka Connectors are components that copy messages between MQ and Kafka. I was interested in seeing how well integrated those operations are with OpenTelemetry tracing. Could I track the flow of a message from its initial creation in one system to its consumption in the other?
Configuration
The MQ configuration has a single queue manager, configured with the Instana Tracing exit. All applications connect as clients to this queue manager, so that we can see the PUTs and GETs.
I used the basic Apache Kafka system, and its standalone connector framework.
For the MQ connectors, I used the versions found here and here. I cloned the repositories, and built the jar files directly. One reason for doing it that way, rather than using pre-packaged jars was so I could add debug print statements if I found it useful. (And I did.)
The driving application was an extended version of the Java-based web server I’d written for the JMS-related article in this series. Operations are triggered by curl requests, which are themselves traced by the OTel instrumentation. For example, curl localhost:4000/MQGET/OC.SINK.QUEUE invokes a JMS operation to retrieve a message from the designated queue. And a trace is generated showing that call.
Although the web server is running within a Spring Boot framework, the JMS operations are made direct to the JMS API; there are no Spring annotations or classes involved for the messaging. Similarly for the Kafka API calls.
Auto-instrumentation
Because the Kafka components and my test application are written in Java, I wanted to use the auto-instrumentation agent processor. There was no custom OTel code in my application. Nor in the MQ Connectors.
I was using what appears to be the latest javaagent release from OTel, version 2.26.1.
The system just needed all the relevant OTel parameters when starting the applications. For the Kafka Connector program, I could do that by setting everything in a specific environment variable. The EXTRA_ARGS environment variable is used within the connect-standalone.sh script. This way I didn’t have to modify any of the Kafka-provided scripts.
# This jar does the dynamic instrumentation
agent=$HOME/otel/opentelemetry-javaagent.jar

# This has to come first as it gets shifted off by the main scripts
props="-name connectStandalone"

# Then add the OTel instrumentation agent and its parameters
props="$props -Xshare:off -javaagent:$agent"
props="$props -Dotel.javaagent.logging=none"
props="$props -Dotel.exporter.otlp.protocol=grpc"
props="$props -Dotel.metrics.exporter=none"
props="$props -Dotel.logs.exporter=none"
props="$props -Dotel.trace.exporter=otlp"
props="$props -Dotel.trace.exporter.otlp.protocol=grpc"
props="$props -Dotel.exporter.otlp.endpoint=http://localhost:4319"

# Set the OTel service name
props="$props -Dotel.resource.attributes=service.name=kafkaConnect"

# Export these parameters as an env var recognised by the Kafka script
export EXTRA_ARGS="$props"

./bin/connect-standalone.sh config/connect-standalone.properties \
                            $curdir/mq-source.properties \
                            $curdir/mq-sink.properties
The MQ Sink Connector
The SINK connector reads messages from a Kafka topic and copies them to an MQ queue. I set the configuration to connect to the queue manager, and naming the topics/queues to work with. The only other configuration changes from the default were:
mq.message.body.jms=true
mq.kafka.headers.copy.to.jms.properties=true
The default value of that attribute is false and means that none of the JMS properties (including the OTel-specific properties carried by the message) are carried forward.
Message Flow
There are three elements to the message flow:
- Web server causes message to be sent to Kafka topic (“Producer”)
- Connector reads message from topic and puts it to MQ queue
- Web server causes message to be retrieved from queue. I had two variants of this: one explicit MQGET (or rather the JMS receive() method) and one using a MessageListener class.
Results
I’d call the results of this test a partial success. Three traces are created, with a link between the first two.
The first trace shows initial production of the message and sending it to Kafka:
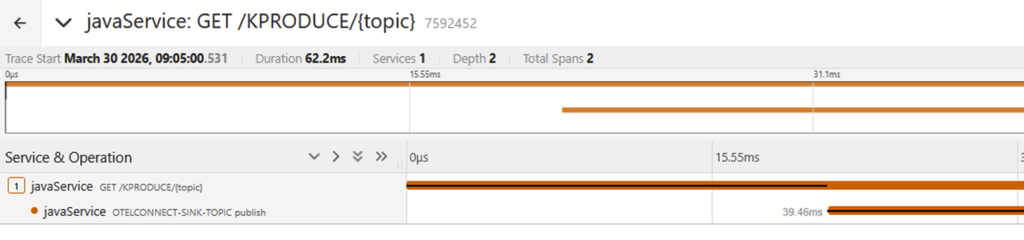
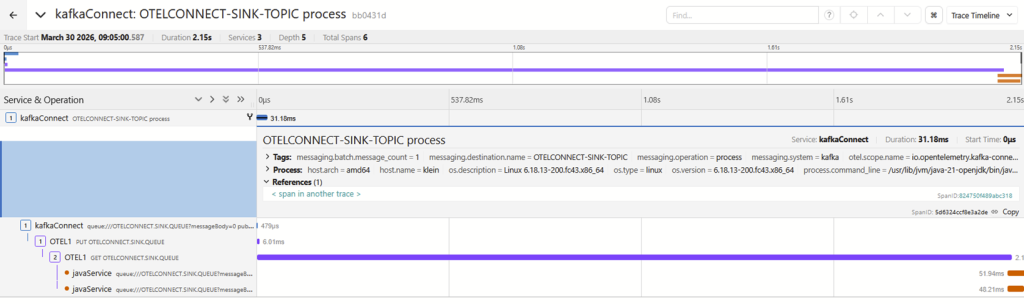
The second trace shows the message being picked up from the topic by the MQ Connector, being sent to MQ, and it then being read by an application. This trace does have a “reference” which is a link to the first trace. So while the flow is not continuous, we can at least see a relationship between the components.
The third trace shows the application being asked to do an MQGET, but that’s all. There is no link to the actual MQGET or any other messaging operation. So we lose the correlation at that point. About the only thing that might be usable to prove a relationship is that the process ID in the last span of the 2nd trace is the same as the process ID in this single span.
Compare that to the work I did with various MQ language bindings.The Go interface, for example, creates a link to the previous trace during MQGET processing. So although there is a separate trace, we can follow directly back to the originating MQPUT.
And indeed, using a Python application based around the Flask toolkit to handle both MQ and Kafka operations in exactly the same way as the Java application creates 3 separate but linked spans. Which does give the end-to-end traceability that I wanted to see.
I had hoped that the Message Listener variant might improve things, as reading the issues raised against the OTel Java instrumentation toolkit suggests some confusion about messaging patterns. But it didn’t make any meaningful difference.
There are also traces created by the Sink Connector’s polling for new messages. These make it harder to find the meaningful traces; you would probably want to apply a filter when viewing them such as messaging.batch.message_count > 0.
The MQ Source Connector
The SOURCE connector reads messages from an MQ queue and publishes them to a Kafka topic. I set the configuration to connect to the queue manager, and naming the topics/queues to work with. The other configuration changes were:
mq.message.body.jms=true
mq.jms.properties.copy.to.kafka.headers=true
Both of these seemed to be required.
Message Flow
Again, there are three stages to the message flow:
- Web server causes message to be sent to MQ Queue
- Connector reads message from queue and publishes it to Kafka topic
- Web server causes message to be read from topic (“Consumer”)
Results
This seemed to be less successful than the Sink connector, with no real relationships between parts of the trace.
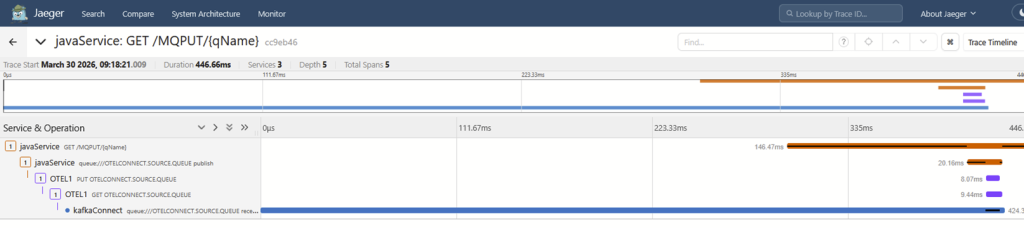
The first trace shows initial production of the message, all the way through to the Source Connector reading it from the queue:
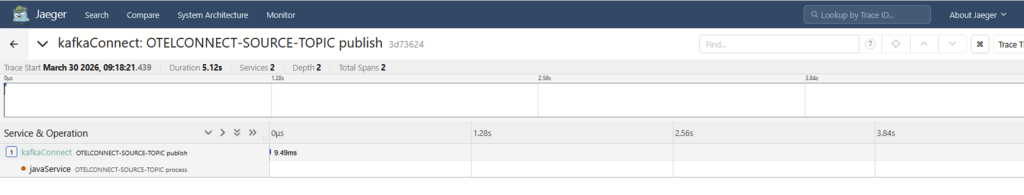
The second trace has just the piece that shows a message being published to Kafka. There are no links or references that can readily tie this operation to the first.
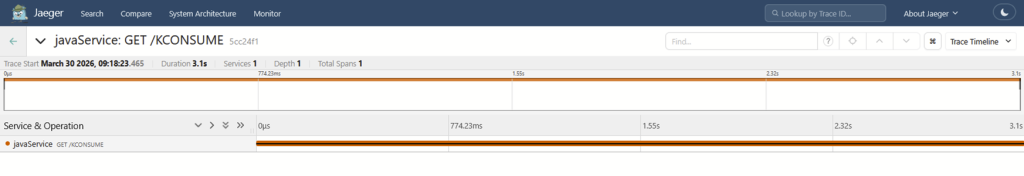
The third trace shows the web server being called, but nothing about the message retrieval:
This makes it very difficult – if not impossible – to track the message flow from end-to-end.
Digging deeper into the javaagentpackage, it appears that it may not properly instrument Kafka Source connectors. There are classes in the file that refer to Kafka Connect Sink objects and APIs, but nothing specifically mentions the Source side of the flow. It’s not clear whether explicit processing is required here or if the “regular” Kafka client instrumentation is sufficient. More investigation is likely required on where any existing trace information is modified.
Conclusion
My earlier article about OTel and JMS demonstrated limitations in the auto-instrumentation when it comes to JMS message retrieval. That seems to be the underlying piece that needs to be worked on. And it’s not something that can be handled in either MQ or Kafka components; it’s an enhancement needed in the OTel javaagent code.
I guess it would be technically possible to enhance the MQ Kafka connectors to explicitly emit traces and spans, but that’s not really a good general purpose solution. And might even be risky, given that those connectors are often running within the same framework process as other connectors whose behaviour we wouldn’t want to affect. It would not, in any case, help with tracking the flow.
At least I now have a testbed that makes it simple to try any future enhancements. And it was good to see how much easier it was to use Kafka than when I last did any real work with it, about 6 years ago.
This post was last updated on May 11th, 2026 at 03:55 pm
One thought on “OTel Context Propagation: part 6 – MQ Kafka Connectors”