The mq-metric-samples collectors that send IBM MQ metrics and status data to a range of databases, ready to be viewed in Grafana, have just been enhanced to collect additional information. The Prometheus collector has also been extended so that it can continue providing limited status even when the queue manager is down.
The new metrics have all been suggested by users of the package either directly or via issues raised in the GitHub repository. Many previous articles on here show more about the collectors.
The InfluxDB collector is also refreshed for a new version of the database.
I was talking to someone tonight who said that it looked like there would be a new layer of bureaucracy applied to how their z/OS system was managed. It made me think of way back, when I first worked for IBM … Hursley’s “production” systems had a level of process and change control. Though as those boxes were all used for development activity it was still less hidebound than you might get (or hope for) in a banking datacentre. But our department had its own mainframe, under more local control. The sysprogs lived on the same corridor, and would do pretty much whatever you needed. Especially after a lunch meeting at the Dolphin.
And then I realised that our MVS system – probably an IBM 4381 if I remember right – was likely sited at pretty much where my desk is now. A desk which I’ve only seen a couple of times over the last year, but where I had to go yesterday after an area-wide power outage that had taken out an old desktop Linux box that would blow away that 4381 with its processing capability. Some of what’s now desks used to be a mini-machine room.
The Linux PC with more power than the mainframe that once sat here
The Request for Enhancement (RFE) system that lets you submit new requirements and ideas for IBM MQ has been moved to a new interface. Just about all IBM products are moving to use Aha! to give a common front-end, and it is now MQ’s turn to migrate.
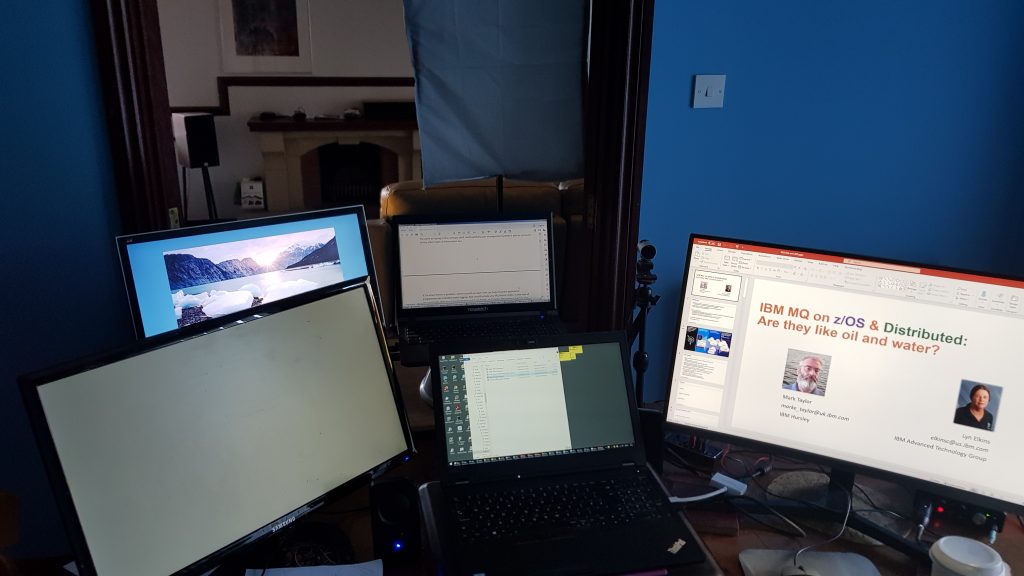
Doing a web seminar session yesterday I knew I wanted a second machine available. Partly as an HA failover backup (just in case), and partly to act as a view of what the other participants were seeing – which I can’t see on the system I’m driving a presentation from. Though as I cabled everything together, it did start to look a little silly. Or like a set from a bad TV show.
Five screens, one desk
But I did actually find a use for just about all of the panels.
The secondary system had the live seminar contents, along with the text-based chat screen so I could see when people raised questions. And I had some written notes associated with the presentations that I could scroll through as the event progressed.
The primary system had one panel with the full-screen presentation, another panel with a preview of the next slide, and a further panel with all my other activities including a chat window where I could type private notes to my co-presenter if necessary.
Could I have managed with fewer screens? Probably, but having all that space did make it easy to manage and have the windows and fonts expanded large enough so I didn’t have to peer hard at small text.
I’ve now moved the 2nd laptop next to the big TV so I can use it to show the county championship cricket games available only via live streaming services. But it can brought back to the desk if needed for another web conference.
If you’ve done any work with the Spring frameworks for Java programs, then you will know that one of the good things about Spring is that it hides a lot of the underlying operations from you. But equally, one of the bad things about Spring is that it hides a lot of the underlying operations from you. I noticed that I was getting several questions about what was happening under the covers from people using the MQ Spring Boot starter. This post shows how you can see what Spring is doing to a queue manager.
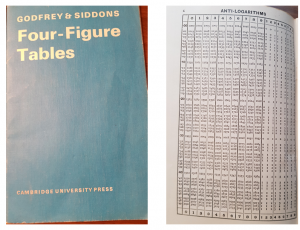
I was doing a crossword puzzle last week, and one of the clues required that you know about logarithm tables. I realised I hadn’t seen those for many years since we’d been taught how to use them at school – calculators were around but not ubiquitous. You had to know how to look up logs (base 10 and natural), sines, square roots etc in these pages. Feeling a bit nostalgic I did a search of bookstores, paid a small amount, and yesterday a book turned up.
Now if only I could remember where I put that slide rule …
It is odd how often similar questions come at the same time from unrelated places. Because of the projects and articles I’ve written about visualising MQ’s metrics in Grafana, I recently had a couple of people asking about using that same front-end but able to work with log-file data. Specifically would it be possible to use Loki and Grafana together with MQ. My immediate reaction was that I didn’t know what Loki was in this context, but clearly they couldn’t be asking about a Norse god or Marvel character. Instead after a very short search and a few minutes reading, I guessed that it ought to be possible to use it. Which was my reply.
But of course, I’m not likely to leave it there when I learn about a new tool. Especially when I have a reasonable starting point like a working local Grafana setup. And so I have done some very quick experiments to prove that the approach really can work. On the way I’ll also take a brief digression into using logrotate.
A requirement I’ve seen a couple of times recently asked how to save an MQ queue manager’s configuration in a different format than MQSC. This short post shows one way to do that.
A new option in MQ 9.2.1 on Unix/Linux platforms gives more flexibility in user management, with no need to make operating system definitions for application users. This post describes why you might want this, how you can use the option and gives a simple example to demonstrate it. Note that this does not apply to Windows or the MQ Appliance.
We’ve recently made available a new repository at https://github.com/ibm-messaging/mq-exits that is intended to hold the source code for various MQ Exits of different kinds.