MQ Metrics with OpenTelemetry

As I promised in a recent article, I am coming back to the OpenTelemetry topic. This time, it’s going to be about another pillar of the observability requirements – integrating MQ’s metrics with OpenTelemetry.

Continue reading “MQ Metrics with OpenTelemetry”

This post was last updated on March 12th, 2024 at 07:27 am

Monitoring MQ availability

One of the focus areas for new development in MQ in recent years has been in the area of High Availability and Disaster Recovery. Technologies such as RDQM and Native HA, and automatically managed logfiles, give a range of possibilities for ensuring your messaging systems continue reliably. Alongside the core function, there are also metrics and status information to show more about what is going on. And so the latest updates to the open source monitor programs add collection of some of these recently-added values. This should simplify monitoring MQ availability.

Continue reading “Monitoring MQ availability”

This post was last updated on February 22nd, 2023 at 10:30 am

Durable subscriptions to minimise object handle use

Collection of the metrics that the queue manager publishes requires that each monitored queue has at least one associated subscription. This post describes an interesting option where collection programs use durable subscriptions to minimise object handle use when running MQ monitoring. It reduces the requirements for configuring the MAXHANDS attribute on the queue manager. It’s also a nice demonstration of how subscriptions could be used in any application.

Continue reading “Durable subscriptions to minimise object handle use”

This post was last updated on June 30th, 2022 at 07:23 am

New features with the MQ Go metric collectors

The mq-metric-samples collectors that send IBM MQ metrics and status data to a range of databases, ready to be viewed in Grafana, have just been enhanced to collect additional information. The Prometheus collector has also been extended so that it can continue providing limited status even when the queue manager is down.

The new metrics have all been suggested by users of the package either directly or via issues raised in the GitHub repository. Many previous articles on here show more about the collectors.

The InfluxDB collector is also refreshed for a new version of the database.

Continue reading “New features with the MQ Go metric collectors”

This post was last updated on November 27th, 2021 at 02:59 pm

Updates for MQ metric exporters

The MQ metric exporters are a set of Go programs that deliver queue manager statistics and status to databases such as Prometheus and Influx. They have recently been updated, giving more consistent function and a much easier configuration. This post will explore and explain these changes.

For an introduction to these exporters, see some of my earlier posts in this blog.

Continue reading “Updates for MQ metric exporters”

This post was last updated on November 27th, 2021 at 02:59 pm

Using Prometheus to monitor MQ channel status

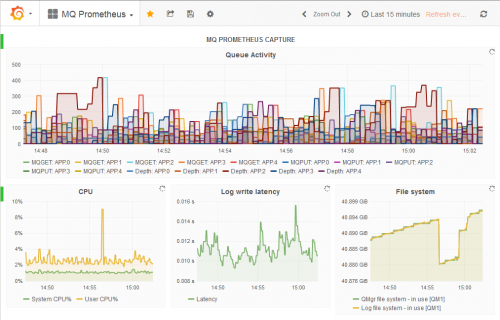
In 2016 I wrote about how MQ’s resource statistics can work with a number of time-series databases, including Prometheus. This permits monitoring using the same tools that many customers use for monitoring other products. It allows easy creation of dashboards using tools such as Grafana.

Since that original version, we’ve made a number of enhancements to the packages that underpin that monitoring capability. For example, more database options were added; a JSON formatter appeared. One notable change was when we split the monitoring agent programs into a separate GitHub repository, making it easier to work with just the pieces you needed.

And now, I’ve released some changes that allow Prometheus and generic JSON processors to see some key channel status information. In particular, a Grafana dashboard can easily highlight channels that are not running.

Continue reading “Using Prometheus to monitor MQ channel status”

This post was last updated on November 25th, 2019 at 09:53 am

Adding resource statistics to your applications

MQ V9 added resource monitoring statistics that you can subscribe to. In this post I’m going to show how you can generate similar statistics from your own applications using the same model. For example, you may want to track how many successful and how many failed messages are being processed.

See how to add statistics generation to your applications

This post was last updated on November 19th, 2019 at 07:41 pm

IBM MQ – Further integration with open-source monitors

An earlier blog entry showed how to integrate MQ with the Prometheus database, capturing statistics that can then be shown in a Grafana dashboard. In this article, I’ll show how that initial work has been extended to work with more databases and collection tools.

The latest updates allow MQ to write directly to InfluxDB and OpenTSDB databases, and also to provide data to collectd.

Continue reading “IBM MQ – Further integration with open-source monitors”

This post was last updated on November 27th, 2021 at 03:00 pm

IBM MQ – Using Prometheus and Grafana to monitor queue managers

In a previous blog entry I wrote about using the Go language with MQ. One of the reasons for creating that Go package was to enable the creation of a program that sends MQ statistics to Prometheus and hence to be easily visualised in Grafana. This blog shows how it all fits together.

Introduction

MQ V9 metrics

MQ V9 (and the MQ appliance) makes many statistics available through a pub/sub interface. One huge benefit of the pub/sub model is that this data can be collected without interfering with any other monitoring programs. An early prototype of the MQ exporter for Prometheus used the RESET QSTATS command just to prove the concept, but that is not a good command to use in general when you have any other tools that may also use it. Publish/subscribe gives easy isolation for monitors.

There is much more information about these metrics in the MQ KnowledgeCenter and other blog posts.

What is Prometheus

Prometheus is an open-source monitoring and alerting solution, whose particular strength is the collection of time series data, with the ability to easily query that data. For example, the number of MQPUTs to a queue may be of interest, and this kind of database makes it easy to see how many operations occurred in an interval, or calculate averages. Prometheus works by pulling information from exporters such as this MQ program at configured intervals over an HTTP connection. It provides libraries in several languages to enable products to export data to it, but the most commonly used is probably the Go library – hence the need for an MQ Go package.

What is Grafana

Grafana provides a way to create dashboards and visualise data held in time series databases. It has Prometheus as a built-in data source, making this pair of products a natural fit together.

Getting started with the monitor

Building the monitor

The github repository contains the monitoring program, the ibmmq package that links to the core MQ application interface and other prerequisite components.

The command

git clone https://github.com/ibm-messaging/mq-metric-samples

should pull down the client code and its dependencies. The README file in the root of that package shows how to compile the code, either locally or within a Docker container.

Configuring MQ

It is convenient to run the monitor program as a queue manager service, automatically started and stopped along with the queue manager.

The source code directory contains an MQSC script to define such a service. In fact, the service definition points at a simple script (also provided) which sets up any necessary environment and builds the command line parameters for the real monitor program. As the last line of the script calls “exec”, the process id of the script is inherited by the monitor program, and the queue manager can then check on the status, and can drive a suitable STOP SERVICE operation during queue manager shutdown.

Edit the MQSC script and the shell script to point at appropriate directories where the programs exist, and where you want to put stdout/stderr. Ensure that the mqm id running the queue manager has permission to access the programs and output files.

The monitor listens for calls from Prometheus on a TCP port. The default port, reserved for this use in the Prometheus list, is 9157. If you want to use a different number, then use the -ibmmq.httpListenPort command parameter.

The monitor always collects all of the available queue manager-wide metrics. It can also be configured to collect statistics for specific sets of queues. The sets of queues can be given either directly on the command line with the
-ibmmq.monitoredQueues flag, or put into a separate file which is also named on the command line, with the -ibmmq.monitoredQueuesFile flag. An example is included in the startup shell script. For example,

mq_prometheus -ibmmq.QueueManager="QM1" -ibmmq.monitoredQueues="APPA.*,APPB.*"

starts the monitor to collect the statistics for all queues whose names begin APPA and APPB.

Note on queue patterns

For now, the queue patterns are expanded only at startup of the monitor program. If you want to change the patterns, or new queues are defined that match an existing pattern, the monitor must be restarted with a STOP SERVICE and START SERVICE pair of commands.

Configuring Prometheus

The Prometheus server has to know how to contact the MQ monitor. The simplest way is just to add a reference to the monitor in the server’s configuration file. For example, add this block to /etc/prometheus/prometheus.yml with any changes needed for your hostnames and ports.

  # Adding a reference to an MQ monitor. All we have to do is
  # name the host and port on which the monitor is listening.
  # Port 9157 is the reserved default port for the MQ monitor.
  - job_name: 'ibmmq'
    scrape_interval: 15s

    static_configs:
    - targets: ['hostname.example.com:9157']

The Prometheus documentation has information on more complex configuration options, including the ability to pull information on which hosts should be monitored from a variety of discovery tools.
Once the Prometheus server has picked up the MQ configuration, the metrics can be seen under the jobname of ibmmq. The values are labelled with the queue and queue manager names, to assist with selection. This picture shows some of the available information in the selection drop-down:

Selecting metrics

You can select an item from this panel and see its recent values with the queue and queue manager labels. For example,

However, it is more flexible to work with the graphing and dashboard views from Grafana.

Configuring Grafana

Once the Prometheus system is working, grafana can use it as a datasource – again, only a hostname and portnumber is required when adding this type of datasource. And from there, all of the MQ metrics can be accessed and added to dashboards. As an example, this dashboard is looking at several items including the same queues as above, and CPU and logging information:

This picture shows how the top panel was configured, to select several metrics and show the object name in the legend:

Deployment in Docker containers

All of these components can be configured to run inside Docker containers to simplify deployment. To get started, almost everything in the existing Prometheus and Grafana containers can be left to default, except for the need to add the MQ configuration to prometheus.yml. For example, I have this simple Dockerfile

FROM prom/prometheus
ADD  prometheus.yml /etc/prometheus/prometheus.yml

where I’ve added the ibmmq block shown above to the default yml file.

And then this script gets both the Prometheus and Grafana components running, using local directories under /var/docker to hold their persistent data:

  docker build -t my-prometheus .
  ARGS="--config.file=/etc/prometheus/prometheus.yml"

  docker run -p 9090:9090 -v /var/docker/prom:/prometheus \ 
    --detach my-prometheus $ARGS

  docker run -p 3000:3000 -v /var/docker/grafana:/var/lib/grafana\
    --detach grafana/grafana

The MQ exporter program and its configuration can also of course be baked into a Docker image. The MQ docker image on Github has information on the configuration of MQ. The service definition, the shell script and the actual monitoring program can all be copied into a new image.

Conclusion

This article has shown how the statistics generated by MQ can easily be used in some of the monitoring packages that are commonly used with various cloud and container-based systems. The MQ data can be integrated with other metrics to give a complete view of your environment.
I would welcome feedback on this tool. Please leave any feedback here, or in the GitHub issue tracker, whether bugs, enhancements, or thoughts on the value of the monitoring.

This post was last updated on November 27th, 2021 at 03:00 pm